Database Capacity Planning
Row Size Calculator
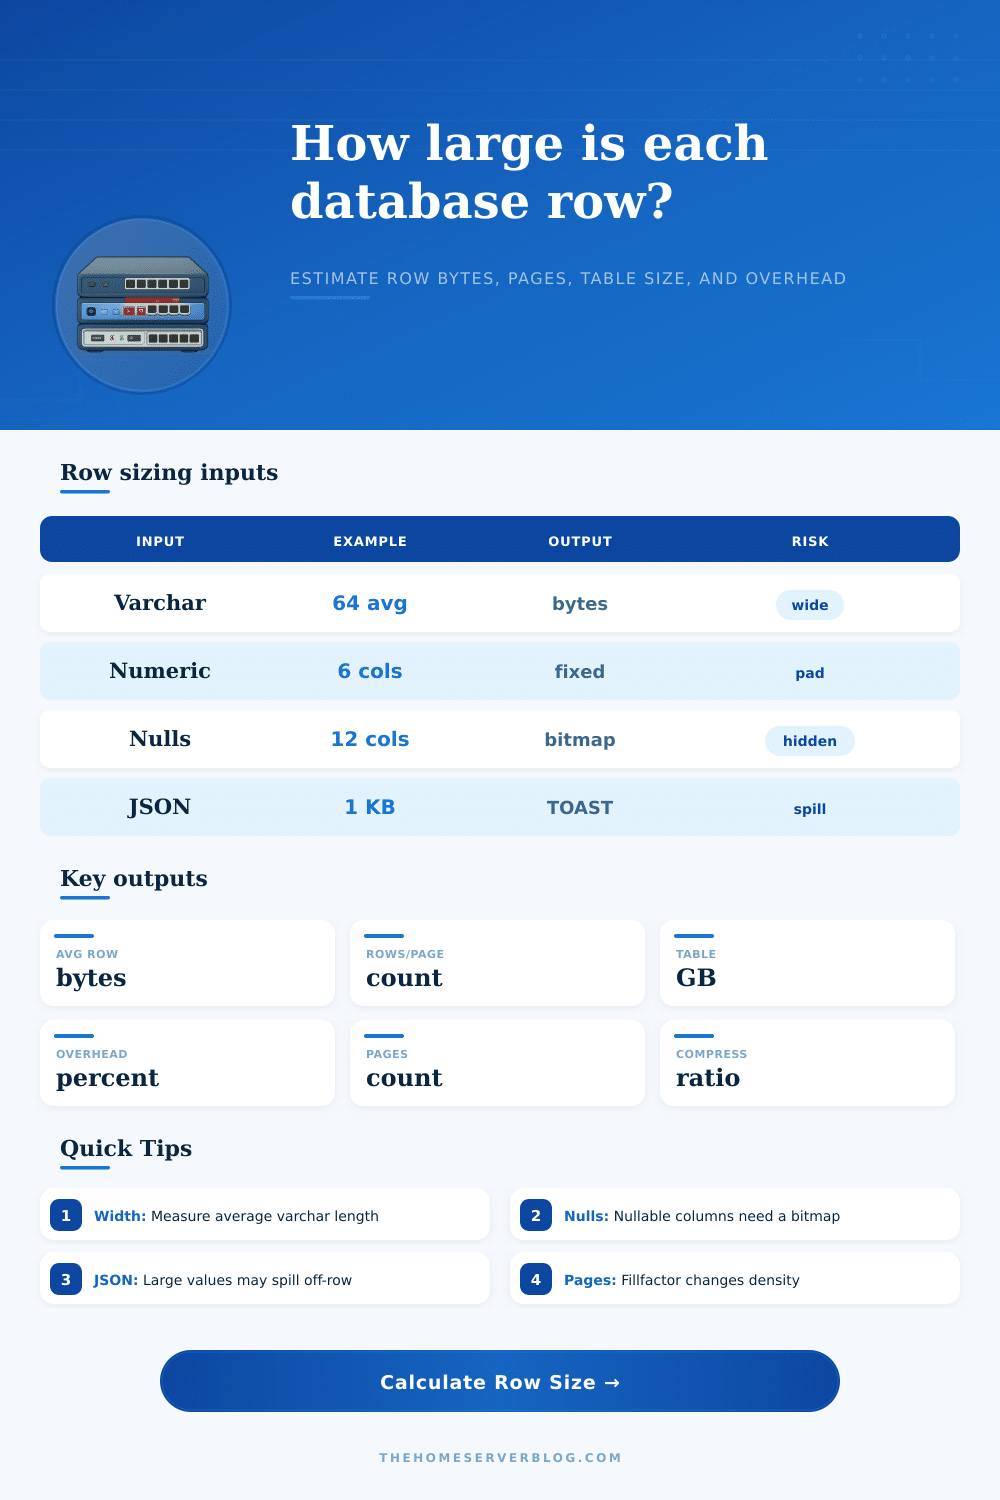
Estimate unique table row sizing from fixed columns, variable text, nullable bitmap overhead, row headers, alignment padding, JSON and blob fields, compression, fillfactor, and page layout.
Byte breakdown
Capacity results
| Type family | Typical bytes | How the calculator uses it | Planning note |
|---|---|---|---|
| Boolean / smallint | 1 to 2 | Modeled as 2 bytes per small integer column. | Some engines pack booleans better; many schemas still pay alignment elsewhere. |
| Integer | 4 | Modeled as 4 bytes per int column. | Common for foreign keys, counters, status ids, and dimensions. |
| Bigint | 8 | Modeled as 8 bytes per bigint column. | Use for large ids, epoch timestamps, monotonic ids, and counters that may exceed int. |
| Decimal / numeric | 8 to 20 | Modeled as 12 bytes per numeric column. | High precision decimals often cost more than float or scaled integer storage. |
| Date | 3 to 4 | Modeled as 4 bytes per date column. | Business dates are compact and usually cheaper than timestamps. |
| Timestamp | 8 | Modeled as 8 bytes per timestamp column. | Time zone metadata may be normalized or stored separately by the engine. |
| UUID / GUID | 16 | Modeled as 16 bytes per UUID column. | Random UUID primary keys can also increase index page churn. |
| Varchar / text | Average length plus metadata | Uses count times average length, adjusted for null rate. | Use measured averages from production, not declared varchar limits. |
| JSON / XML | Highly variable | Uses average inline bytes or an off-row pointer above threshold. | JSONB, XML, and compressed document formats can change row density sharply. |
| Blob / LOB | Highly variable | Uses average inline bytes or an off-row pointer above threshold. | Keep binary payloads off hot OLTP rows when scans and cache density matter. |
PostgreSQL heap
Often modeled with a larger tuple header, null bitmap, line pointer, 8 KB pages, fillfactor, MVCC versions, and TOAST pointers for large values.
MySQL InnoDB
Clustered primary key rows live in B-tree pages. Variable fields, NULL flags, record headers, page directory slots, and overflow pages affect density.
SQL Server
Rows include status bytes, fixed and variable column areas, null bitmap, slot array, page header, and optional row or page compression savings.
Oracle heap
Block overhead, row directory, row headers, trailing null handling, PCTFREE, chaining, migration, and LOB storage all influence usable row density.
| Preset | Typical table | Dominant width driver | What to verify |
|---|---|---|---|
| User Profile | Account and profile table | Varchar fields and JSON preferences | Email/name averages, profile JSON size, soft-delete columns. |
| Order Header | Commerce order master | Money columns, addresses, timestamps | Address text averages and nullable promotion fields. |
| Event Log | Append-only application events | JSON event properties | TOAST or overflow behavior for large payload spikes. |
| IoT Telemetry | Sensor readings by device | Timestamp and numeric samples | Whether repeated metadata belongs in dimensions. |
| Ledger Entry | Accounting or wallet ledger | Decimal and UUID columns | Precision choice, partitioning, and index multiplier. |
| CMS Article | Content metadata and body | Long text and JSON SEO metadata | Inline body storage versus external content store. |
| Inventory SKU | Product catalog inventory | Text attributes and numeric stock fields | Attribute JSON growth and nullable dimensions. |
| Session Store | Login/session records | Blob token or serialized state | Expiry policy, compression, and off-row pointer cost. |
| Audit Trail | Change history table | Before/after JSON payloads | Retention, compression, and external payload size. |
| Metrics Rollup | Aggregated time-series table | Numeric measures | Column count and rollup grain before adding indexes. |
| Media Metadata | File records and transforms | JSON metadata plus URLs | Keep binaries out of the hot metadata table. |
| Wide Analytics | Many-dimensional fact table | Large count of fixed and nullable columns | Padding, nullable bitmap, and columnar alternatives. |
Three months after deployment, you may find your disk usage exploding for no obvious reason. It’s hardly ever because of some huge column. Instead, it is because of small amounts of extra space used for row headers, null bitmaps, padding for alignment and variable-length metadata. These are bytes that don’t even show up in your SQL definition.
These are the ones that determine how many rows will fit on each database page, which means they affect how much memory your app ends up using. The calculator above let you guess at this density, turning abstractions into bytes before schema becomes production size.
Why Small Details Use Lots of Space
Take the varchar field. How many times have you seen a developer specify varchar(255) as max length? Why do they do that? To be safe! Well here’s the deal… The storage engine doesn’t give a crap about the upper bound. It cares about content you store. And if your average email address is 48 bytes long, then thats what counts when it comes to row size. In nearly every moddern row store, declared length doesn’t matter at all.
It may matter for validation logic, but it won’t impact how much space you consume on disk. That is what the tool wants to know, the average length. That determines the size of variable offset array. That determines how much space the actual data take up. This makes a huge difference for cache efficiency because you’re saving terabytes of wasted space.
Columns with fixed widths may appear simple at first glance, but they also has their little details. If you place a two-byte field next to an eight-byte one, it might be padded with extra bytes. They are always four bytes wide. Eight bytes wide? It is usually eight. But wait, here’s where databases get clever: They line up data on memory boundaries. This is for performance.
You put a column that’s two bytes wide beside another thats eight bytes wide? Often there will be padding bytes inserted. Why? So it’s clean. And this alignment needs no consideration from you in your code, yet it’s very real on disk. To make up for this, the calculator takes into account physical layout.
It factors in the null bitmap and the row header. The bitmap allows tracking which columns are potentially NULL. It’s tiny per-row but it adds up over millions of rows. This is especially true if you’re dealing with dozens of nullable column.
These may be binary large objects or other types of fields that often spill to another storage area on the page. That way the main page isn’t too big, then it just stores a pointer in the row. The pointer is far smaller than the data itself. If most of your data spools off-page, this means that your main table doesn’t become bloated. It doesn’t store giant amounts of data which aren’t ever read fully. Knowing what spills and what doesn’t change everything about how you store. You may believe you’re storing five hundred bytes per row, half of it has actually been stored somewhere else.
The other factor is the page size/fillfactor. How densely does it pack your data? Typically, an 8k page size is used. With a low fillfactor (leaving free space on each page for updates), you trade off density for performance when writing to disk. That’s important for highly-changing tables. To gain write performance, you sacrifice density. You want to avoid page splits and fragmentation because they hurt insert performance. You tune this with the fillfactor to lessen those effects. This calculator allows you to turn that knob. Want write speed at any cost? Then you can estimate how much more space you’ll be paying for in raw form.
Another wrinkle in this story is compression. This will greatly reduce amount of space used on text heavy rows. It will also use CPU when reading or writing that data. How this helps you realy comes down to what workloads you’re running. For a simple key value lookup, the CPU cost of compression might not be worth the storage savings. But if you have an analytical scan across millions of rows, you’ll probably want to use data compression to cut down on IO. Different levels of compression ratio is modeled so you can see how much overall row size is going to change.
So why does all this matter? Database performance is ultimately about prediction. What you don’t measure, you can’t optimize. Knowing how every column type impact your overall row size helps you make smarter decisions. And those decisions are tied to partitioning and indexing.
More nullable columns means wider tables (with greater overhead). Hot data should be kept dense so that more rows will fit inside memory. This, in turn, run faster without any additional hardware. The point is, the more useful data we can cram into the cache, the better. Understanding the hidden cost of storing stuff makes it impossible to guess. You begin building intentionally rather than blindly.
And that clarity transforms a brittle system into a strong one. It is capable of scaling without crumbling underneath itself. You now have perfect knowledge of how much each slice of information actualy requires.