Load balancer affinity planner
Sticky Session Capacity Calculator
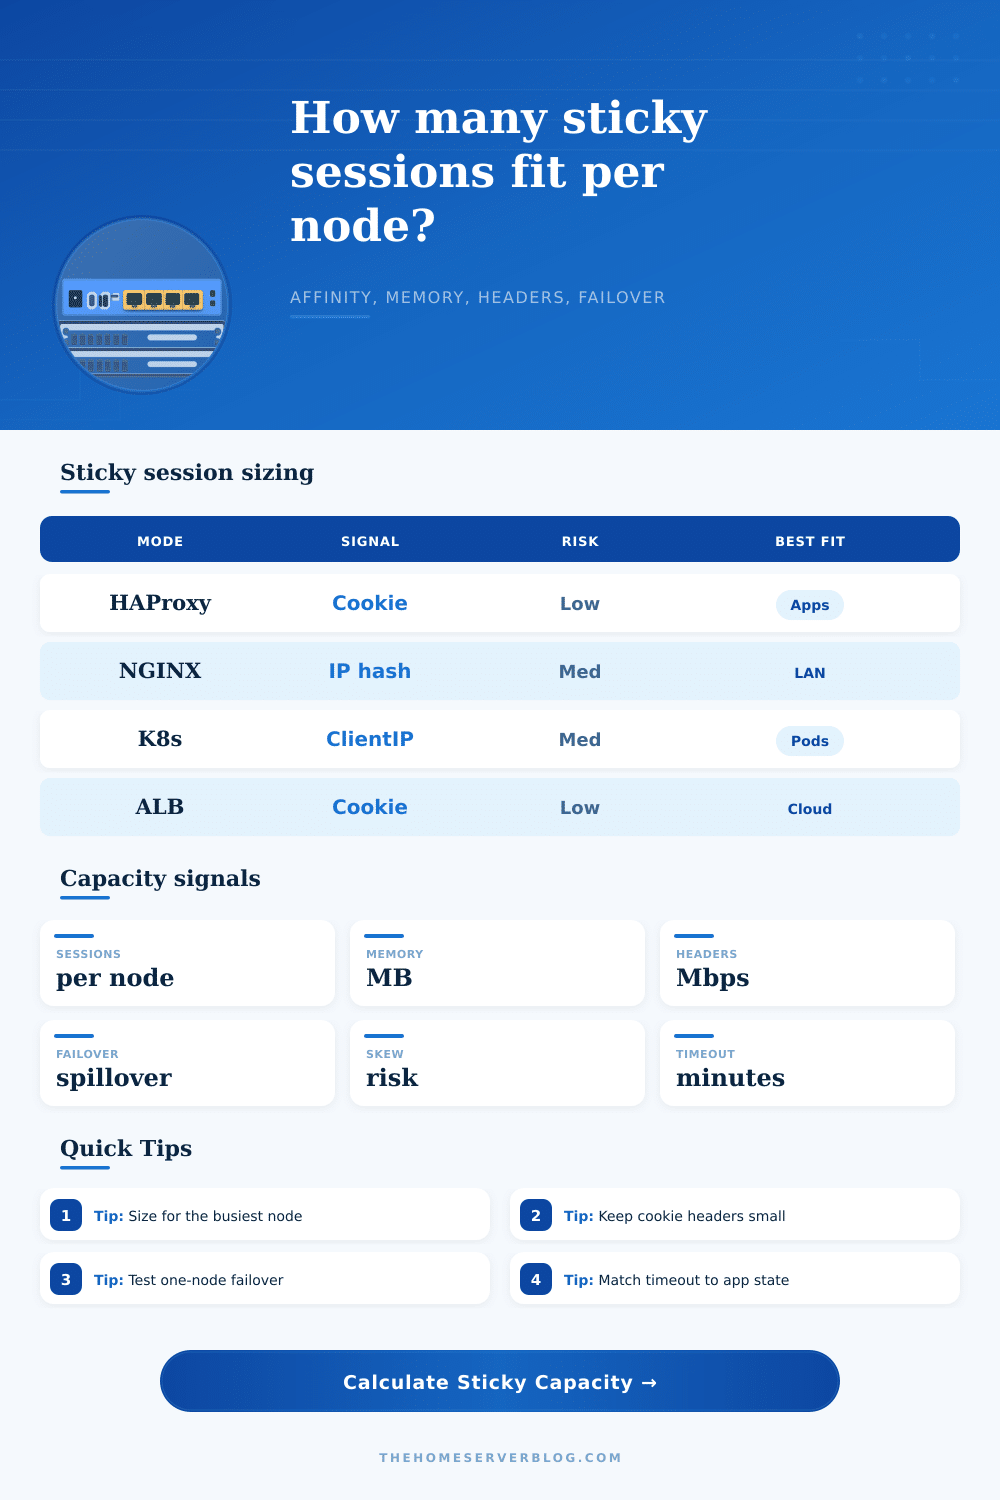
Estimate active sticky sessions per backend node, session memory, cookie/header bandwidth, affinity skew, and one-node failover spillover for cookie, IP hash, Kubernetes ClientIP, ALB, and long-lived dashboard traffic.
Full sticky-session breakdown
Capacity signal
| Affinity mode | Routing signal | Typical skew | Failover behavior | Best home lab use |
|---|---|---|---|---|
| HAProxy insert cookie | Backend cookie value inserted by the proxy | 6% to 10% | Lost node sessions reconnect through balance policy | PHP apps, admin panels, small clusters |
| NGINX ip_hash | Client IP hash mapped to upstream | 18% to 28% | Hash ring shifts when upstream list changes | LAN dashboards with stable client IPs |
| Kubernetes ClientIP | Service sessionAffinity keyed by client IP | 12% to 18% | Pod churn can strand hot clients until timeout | Ingress-backed apps and pod pools |
| AWS ALB duration cookie | Load balancer generated duration cookie | 8% to 12% | Target health sends new requests to healthy targets | Cloud test stacks and hybrid labs |
| Application cookie route | App-generated route or shard cookie | 10% to 16% | App logic decides whether stale routes are accepted | Cart, SSO, game lobby, and tenant routing |
| Workload | Common sticky window | Idle timeout concern | State size range | Capacity note |
|---|---|---|---|---|
| WordPress admin affinity | 30 to 60 minutes | Login forms and uploads can reset sessions | 16 to 128 KB | Watch plugin-heavy admin requests |
| PHP cart cluster | 20 to 45 minutes | Cart and CSRF state often live server-side | 32 to 256 KB | Large carts make node memory uneven |
| SSO login burst | 5 to 15 minutes | Short spikes can overload one login node | 24 to 96 KB | Size for peak, not daily average |
| Websocket dashboard | 60 to 240 minutes | Connection drain matters more than request count | 64 to 512 KB | Failover can reconnect many clients at once |
| Game lobby shard | 10 to 30 minutes | Party placement can create hot shards | 32 to 192 KB | Protect matchmaking and lobby metadata |
| Backend count | One node lost | Survivor load multiplier | Practical rebalance target | Sticky-session action |
|---|---|---|---|---|
| 2 nodes | 50% capacity removed | Up to 2.00x | 80% or higher | Prefer shared session store or fast drain |
| 3 nodes | 33% capacity removed | Up to 1.50x | 65% to 80% | Keep spare CPU and memory on every node |
| 4 to 6 nodes | 17% to 25% capacity removed | 1.20x to 1.33x | 50% to 70% | Node draining usually controls the event |
| 7+ nodes | Less than 15% capacity removed | Near 1.15x | 40% to 60% | Skew and NAT often matter more than failure |
| Layer | Common watch point | Sticky impact | Calculator input | Planning note |
|---|---|---|---|---|
| Browser cookies | Per-domain cookie totals | Every request carries affinity and auth bytes | Cookie/header bytes | Keep route cookies short and avoid duplicate flags |
| Reverse proxy buffers | Large request headers | Oversized headers can cause 400 or 431 responses | Cookie/header bytes | Auth tokens often dominate sticky cookie overhead |
| Load balancer health | Target or upstream removal | Existing sticky sessions must reconnect or drain | Failover rebalance percent | Test graceful drain before patch windows |
| App node memory | Local session store and socket maps | Busiest node owns more state than average | Session memory per client | Size memory from busiest-node estimate |
The calculator uses planning-grade estimates, not vendor hard limits. Compare the output with your proxy, browser, ingress, and app runtime configuration.
Sticky Session Skew: You know that feeling when you deploy a new backend node and suddenly one server hits ninety percent CPU while its sibling sit idle? By default, load balancers don’t distribute requests at random. Instead, they pin users to certain backends to maintain state. This creates the illusion of balance but it breaks whenever nodes fail or traffic patterns change. That’s where sticky session skew come from.
The calculator above do the math for you. It translates abstract affinity policies into concrete session and memory limits. The price of scale is complexity: sticky sessions are an example where the tradeoff is simple vs scalable. On the plus side, each client’s data reside only on one server, which means easy state management. On the minus side, this cause uneven load on servers. This tool makes you face this fact head-on.
Why Sticky Sessions Cause Problems
Enter number of backend nodes (assumed healthy) and client count and it will calculate baseline share. But it does more than that. It multiplies by the skew factor depending on what affinity mode you choose. Generally, HAProxy cookie insertion keep the share quite tight, usually less than 10% away from perfect balance. IP hashing can be quite far off though. This is especially true if multiple clients is behind a single NAT address at a school or office.
But that’s when it gets tricky for most teams: memory. Sure, 32 KB per session sounds small… Until you multiply that by 12,000 active sessions on a single node (thanks, NAT skew). That calculator doesn’t present you with an average; it shows how much memory will be consumed on your busiest backend. Sizing for average is a recipe for out-of-order errors at peak. Size your nodes for worst case. In reality, that’s typicaly just sizing for the single most loaded server in your cluster.
Cookie overhead is another quiet source of wasted resources, often neglected until latency spikes. Those bytes get added to each and every request; back and forth from client to load balancer. You might have a big authentication token in there or some bloated tracing data that waste resources with every step. To get an idea whether or not your headers are consuming lots of your network capacity, the tool estimates wire overhead for you too. Smaller headers aren’t only good for making things faster. They’re also good for staying under browser limits and proxy buffers which can cause full-on connection drops.
The most important aspect of all this is the planning for failure. A dead backend doesn’t mean a lost session. Those sessions need to spill over onto the rest of your survivor. This spillover is modeled by the calculator. You can see how much of an increase it brings to each surviving node. If you’re on just three nodes and one fails, those last two are taking a fifty percent hit. That’s a multiple that will shove some CPUs into the red and/or exceed your memory limits. Theory is never as good than the chaos of a real-world production failover; you need to test this out in staging.
Each workload requires a unique approach. For example, long-lived connections in a WebSocket dashboard are very different than the five-minute bursts of SSO logins. The page help you associate these behaviors with expected sizes of states and timeouts. Remember, the key is matching your idle timeout against how much your app actualy retains per connection. You hoard memory by setting it too high. You kick people out too soon by setting it too low.
We’re not doing this as an exercise in number crunching; we want to show the details that come into play when building out an affinity strategy. You could of learned from failover, memory, and skew’s interaction to decide if you want to use a simple cookie-based routing scheme or something more complicated that relies on shared state. Knowing where your bottlenecks are is always better before your users find them. Size for the storm, not the calm and your cluster will appreciate it when traffic inevitablly goes sideways.