HomeServerBlog capacity tool
Load Balancer Connection Calculator
Model front-end active connections, backend socket demand, pool headroom, health check overhead, and TLS handshake CPU time before changing HAProxy, NGINX, Traefik, ingress, or tunnel limits.
Calculation breakdown
Capacity verdict
The meter tracks the busiest backend against its configured connection cap.
| Mode | Front-end shape | Backend effect | When it surprises you |
|---|---|---|---|
| HTTP/1.1 short connections | Lower idle count, higher churn | Weak reuse, more connect bursts | TLS handshakes dominate small APIs |
| HTTP/1.1 keepalive pool | Client count closely maps to sockets | Good reuse when upstream pools are warm | Idle timeouts can hide true peak sockets |
| HTTP/2 multiplexed edge | Fewer client sockets carry many streams | Backend may still fan out as HTTP/1.1 | One hot client can drive many upstream requests |
| HTTP/3 QUIC edge | UDP connection IDs reduce reconnect pain | Origin pool still needs ordinary capacity | CPU and packet handling move to the edge |
| Preset | Traffic personality | Dominant limiter | Best first tuning knob |
|---|---|---|---|
| Home HAProxy Pair | Mixed dashboards, phones, and small services | Backend caps during restarts | Raise maxconn only with app proof |
| NGINX Reverse Proxy | Static pages plus API calls | Worker connections and TLS CPU | Enable upstream keepalive pools |
| Traefik Docker Lab | Many small containers behind labels | Container app socket limits | Separate noisy services from shared routers |
| Kubernetes Ingress | Bursty east-west and north-south traffic | Pod fan-out and readiness churn | Scale replicas before endpoint pressure |
| Cloudflare Tunnel Origin | Few tunnel sockets, many remote users | Origin app pool and tunnel concurrency | Run multiple connectors across hosts |
| API Gateway Burst | Short request spikes from jobs or webhooks | New connection rate and TLS handshakes | Increase reuse and smooth clients |
| Platform class | Useful connection range | Network fit | TLS expectation | Operational note |
|---|---|---|---|---|
| Mini PC dual NIC | 1,000 to 20,000 active sockets | 1 GbE or 2.5 GbE home edge | Strong with AES-NI | Good for HAProxy or NGINX failover pairs |
| Low-power ARM board | 300 to 5,000 active sockets | 1 GbE lab ingress | Mixed; test handshake rate | Watch file descriptor and IRQ limits |
| Virtual machine on NAS | 800 to 12,000 active sockets | Shared 1 GbE to 10 GbE uplink | Depends on host contention | Reserve CPU during backup windows |
| Dedicated firewall appliance | 2,000 to 50,000 active sockets | 2.5 GbE to 10 GbE edge | Often good, verify ciphers | State table limits may be lower than RAM suggests |
| Kubernetes worker node | 5,000 to 100,000 active sockets | 10 GbE or faster fabric | Good with ingress replicas | Endpoint churn and conntrack limits matter |
| Busiest backend usage | Status | Meaning | Action |
|---|---|---|---|
| Below 60% | Comfortable | Enough room for retries, reloads, and minor service skew | Keep monitoring real peak and reuse ratio |
| 60% to 80% | Watch | Normal surges are acceptable, but rolling restarts can pinch | Confirm backend max connections and timeouts |
| 80% to 95% | Tight | One backend loss or cache miss wave may queue traffic | Add backend capacity or lower client surge |
| Above 95% | Critical | The pool is effectively full during the modeled peak | Scale immediately before raising timeout values |
When your load balancer begins to drop connections, it doesn’t shout from the rooftops. There’s no flashing red light on your dashboard, nor any sirens blaring. Just a slow degradation: your login form spins forever, or your API responses take an extra two hundred milliseconds. This silence is deceiving, masking the fact that by the time your servers crash, your socket limits has already been breached for quite some time.
Rather than guess at your peak traffic, understand how your connection pressure is building up behind the scenes, so that you can avoid the sort of silent failure described above. Bandwidth is what most folks size their proxy hardware around, but connections are a harder limit to hit and much more painful to debug.
How to Prevent Load Balancer Failures
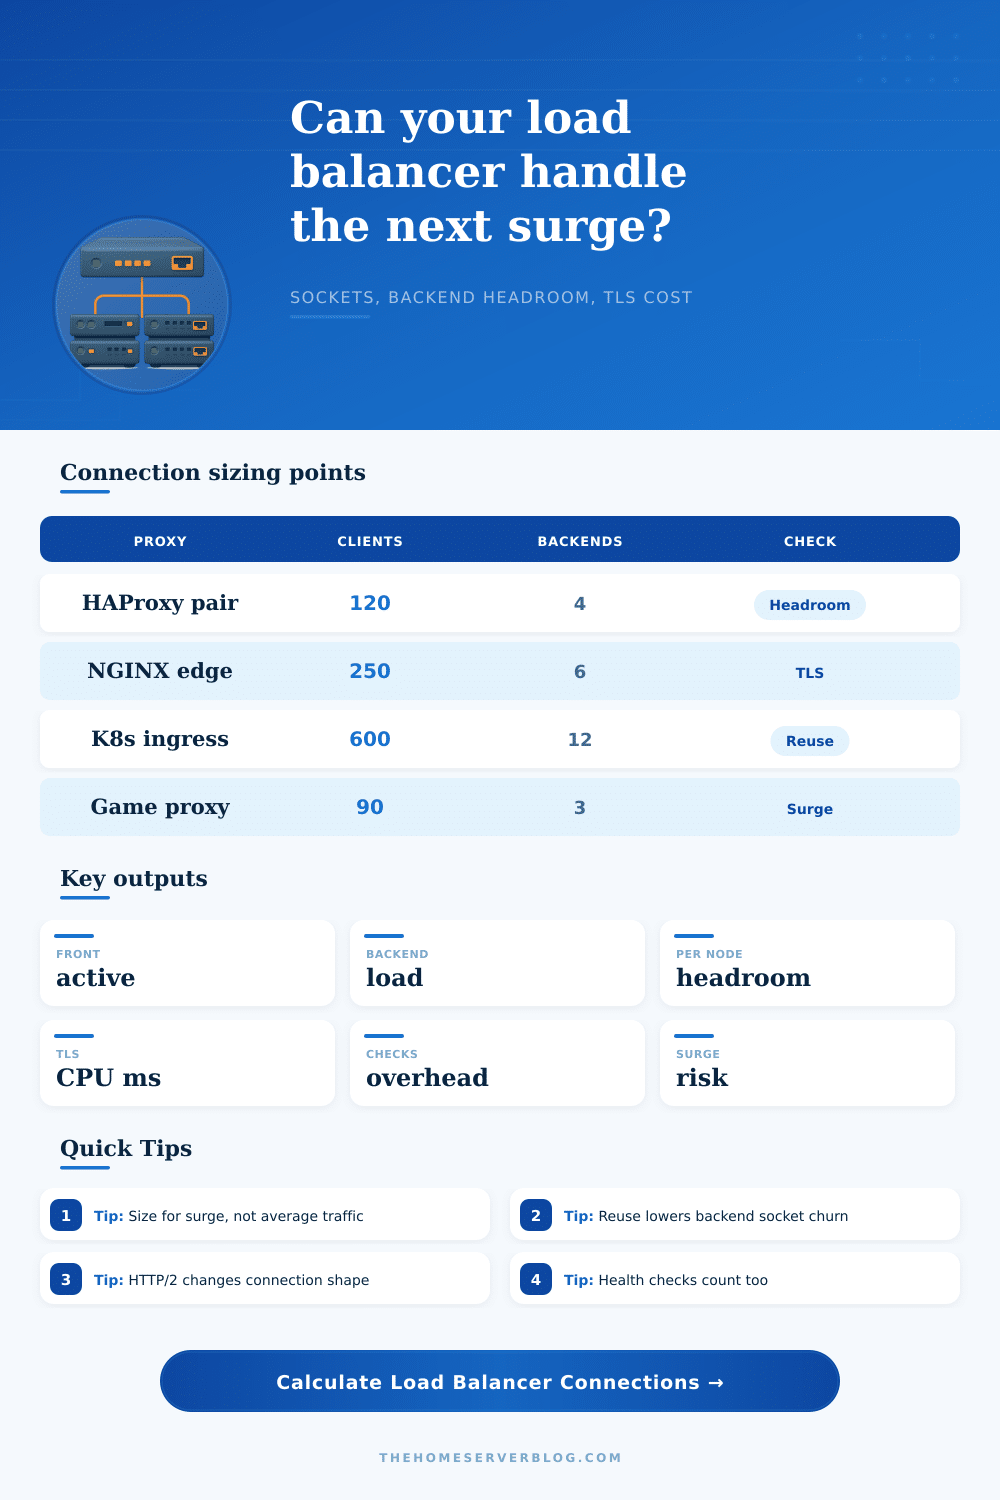
Plug in your backend pool sizes and client counts into calculator above. It will do all the math for you. You won’t have to manually track each hand from an edge listener up to an upstream server.
It makes you recognize active sockets as a limited resource that will drain under high churn conditions, and differentiate between how many clients are knocking on your front door vs. How much work does that request cause to your internal apps? Backend sockets talk directly to your virtual machines or application containers. Front-end sockets face your users.
Moddern protocols such as HTTP/2 can multiplex multiple concurrent streams over a single client connection. Because of that multiplexing, these two numbers don’t necessarily line up, and you shouldn’t be over-provisioning your front-end capacity based on old assumptions.
But you should be aware that backend connections suffers from poor reuse rates. Each new request creates a new TCP handshake with your origin servers. That churn consumes CPU cycles and file descriptors. An average traffic graph won’t ever reveal this to you. People tend to look at only throughput numbers but what they don’t notice is how much time each connection spends in transition state. If your reuse percentage decreases, every incoming request becomes an expensive operation (requires memory allocation + handles a kernel interrupt).
This is why we include expected burst multipliers and keepalive timeouts in our model so that it can show you a realistic picture of how many sockets you’ll need during a stress event. Pay special attention to the per-backend headroom output as this tells you how far away your busiest node is from reaching its hard limit.
The other wrinkle is the TLS handshake process. This adds complexity depending on what your hardware can do. Cryptographic operations takes up a certain amount of CPU time that scales linearly with the length of each secure connection’s requested handshake. For a low-powered ARM board or even a modest home server doing TLS termination, this cost can be the primary limiting factor long before any limit on network bandwidth kicks in.
The page has a reference table outlining how different platforms fare with different socket ranges and expectations around crypto. It’s a balancing act between meeting your security needs versus raw processing horsepower for those first few back-and-forths.
The intersection of theory and practice happens in the area of surge risk, which arises when unexpected surges happen (e.g., a sudden increase in traffic, a viral social media post, a deployment event). Your system may be humming along healthily under typical load, but that all changes with a rolling restart or a viral social media post that multiplies your connection count by four times than your normal amount.
To account for the sudden increase, ensure you model in sufficient spare capacity to absorb such shocks without queueing up requests while the backend is out of breath. You’d rather have some idle sockets waiting around than see your application time out since every possible path is filled up.
Even seemingly small things, such as health checks, end up contributing to the overall socket budget. A single check every few seconds on each backend doesn’t sound so bad. But then multiply that by several dozen nodes. You end up in a partial outage scenario where those sockets stay open and count towards your limit while the system tries to heal itself.
When everything starts going right, rather than wrong, don’t ignore the background noise, since you’ll be surprised at how it adds up to a capacity crunch. To size for optimal performance, you need to consider the worst-case scenarios. You must account for when the backend is saturated, there is a lot of TLS overhead, and reuse fails significantly.
This isn’t about increasing the efficiency of each individual resource. It’s about leaving enough air between them so that when something temporary goes wrong it doesn’t snowball into complete service outage. You want your infrastructure to be able to recover from the unknown on its own even in the middle of the night.
But in the end, managing connections has more to do with anticipating where the friction points are than anything else. If you have a sense for how connections flow between edge listeners, proxy workers, and application threads, then you know what’s invisible and can better anticipate its impact on your systems’ stability. As I said earlier, if you treat your memory allocations and disk space with respect, do so with the same attitude toward your connection pools. Because the creeping death I described up top is avoidable.