Load balancer request spread planner
Round Robin Distribution Calculator
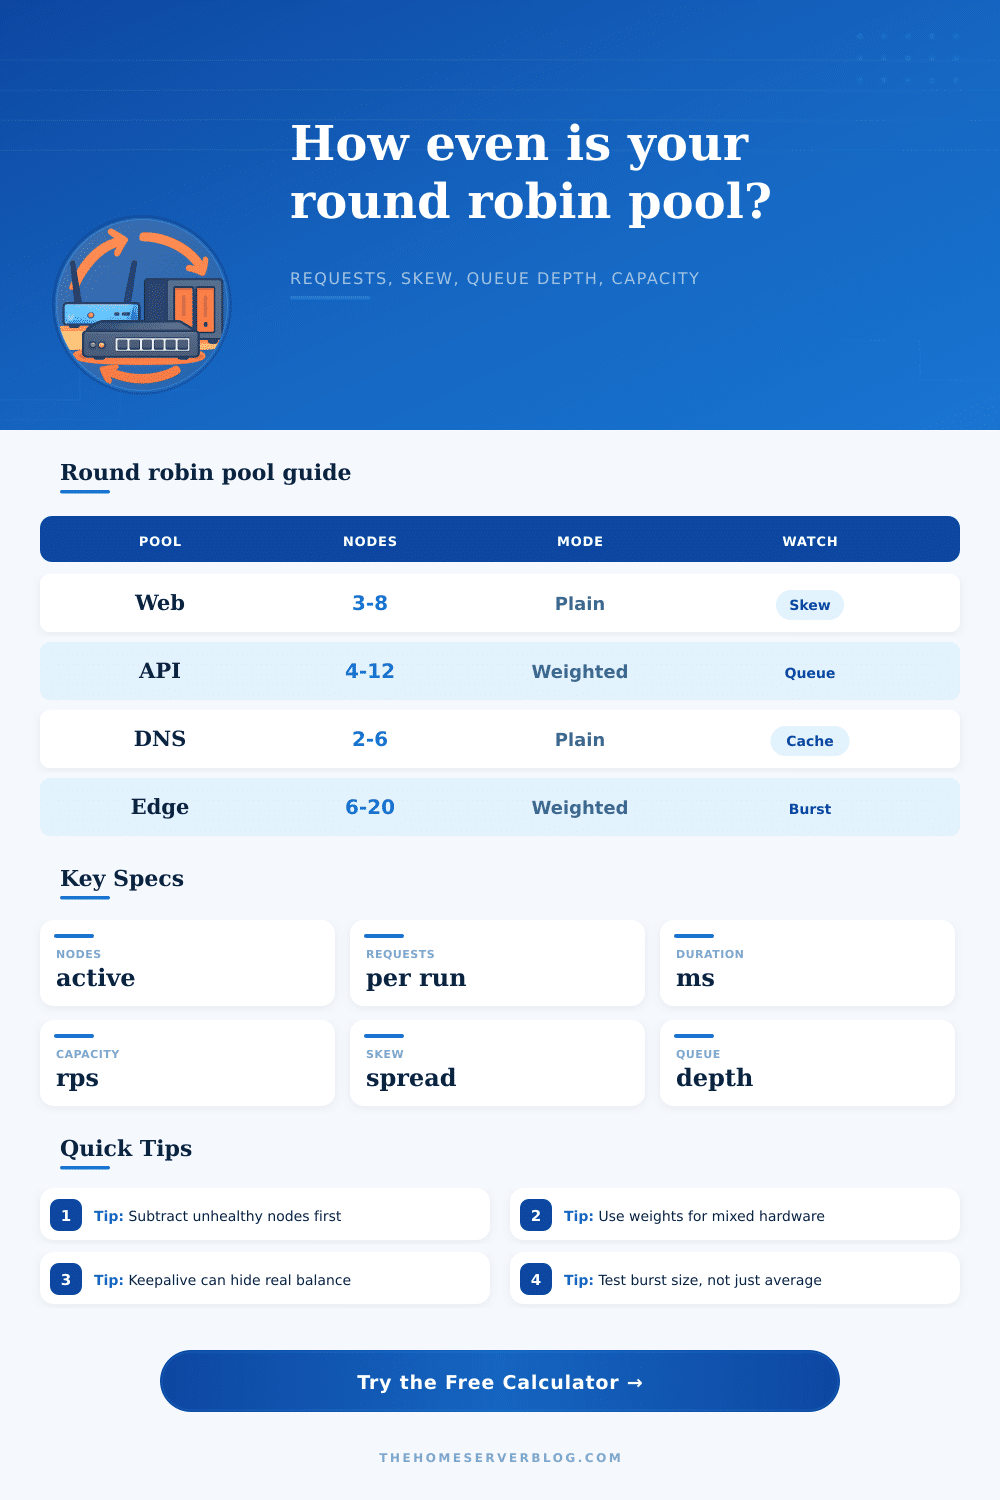
Estimate how plain or weighted round robin will spread requests across healthy backends, including offset, burst behavior, keepalive reuse, capacity headroom, and queue pressure.
Full calculation breakdown
Backend request split
| Mode | Best fit | Distribution behavior | Risk to watch |
|---|---|---|---|
| Plain round robin | Similar backends | Each healthy node gets the next request in sequence. | Uneven capacity if nodes are not equal. |
| Weighted round robin | Mixed hardware | Backends repeat in the cycle according to configured weight. | Wrong weights overload smaller nodes. |
| DNS round robin | Simple public records | Answers rotate, but clients and resolvers cache results. | Observed traffic may not match answer order. |
| Least connections | Long requests | New traffic favors nodes with fewer active connections. | Can oscillate when durations vary widely. |
| Backend count | Perfect cycle | One extra request | Skew note |
|---|---|---|---|
| 2 backends | Every 2 requests | 50.0% vs 50.0% plus one | Remainder is easy to see in small tests. |
| 3 backends | Every 3 requests | 33.3% share plus one | Large samples converge quickly. |
| 4 backends | Every 4 requests | 25.0% share plus one | Offset only changes which backend leads. |
| 8 backends | Every 8 requests | 12.5% share plus one | Bursts need enough requests to show fairness. |
| Keepalive reuse | Impact | Symptom | Practical check |
|---|---|---|---|
| 0% to 10% | Low pinning | Access logs nearly match the cycle. | Plain round robin tests look clean. |
| 20% to 40% | Moderate pinning | Some clients stay attached to earlier choices. | Check per-client source counts. |
| 50% to 70% | High pinning | Hot clients can dominate a backend. | Inspect upstream connection reuse. |
| 80% plus | Very high pinning | Round robin mostly affects new connections. | Test with connection churn enabled. |
| Scenario | Typical pool | Capacity rule | Queue warning |
|---|---|---|---|
| Home web pool | 2 to 4 app nodes | Keep 25% spare RPS after one failure. | Burst exceeds worker slots. |
| Webhook receivers | 3 to 6 API nodes | Size for retry storms and provider bursts. | Queue rises during downstream pauses. |
| Static assets | 4 to 10 cache nodes | Weighted mode helps mixed disk or NIC speeds. | One node serves oversized objects. |
| TLS termination | 2 to 8 edge nodes | Capacity depends on handshakes and reuse. | CPU saturates before request RPS. |
This calculator models practical request distribution for home lab and small production pools. It is meant for planning, sanity checks, and comparing scenarios before load testing.
Spin up three web servers, throw them behind a load balancer and voila: traffic flows evenly across the board. Everything is perfect until one afternoon when one of the servers lags while the others sits idling. The algorithm didn’t fail you, your assumptions did. Round robin distribution is easy to look at on paper. Cycle through nodes in order. It is simple. Reality adds friction though. Connections stays connected longer than they should. Some requests are heavy lifters that block threads for seconds instead of milliseconds.
Plug in your request patterns and node counts into the calculator above and it’ll do the math for you. Save yourself the guesswork on what these small problems realy mean in terms of capacity.
Why Round Robin Load Balancing Is Not Perfect
First, there is no rule that says being even is always good. What people fail to understand about load balancing is that being even can be unhealthy. Consider a pool of three otherwise-identical virtual machines. Every request on them always requires exactly the same amount of time. In that case, a simple round-robin approach would dole out requests equally well. In reality, however, production traffic isn’t like that at all. Some fraction of it will likely be database-heavy API calls; some other fraction might be serving static assets. Plain old round robin is a blunt instrument, it doles out work but never asks what kind of work.
Now, enter weighted mode. You say “hey, I want my backend with the heaviest workload to receive requests more frequently than these others” and it’ll visit your stronger backends more during course of the cycle. Weighted mode allows you to model that behavior by tweaking weight pattern. This shows you how the skew changes depending on whether one node is double-burdened compared to another.
Finally, there’s also keepalive reuse. Sometimes a client opens connection and leaves it open while making multiple requests. To avoid overhead of handshakes, the load balancer will route all further requests back to the same backend rather than closing and reopening the connection. That completely disrupts the round robin cycle for those active users. To account for that, you can specify a keepalive reuse percentage in the calculator, which lets you simulate a certain amount of connection sticking: if you set it to twenty percent, it models moderately sticky connections. As you increase the number of clients who hang onto their connections, you’ll be able to see the difference between theoretical distribution vs actuality. It doesn’t seem like much, but it matters because you’re going to misinterpret your access logs if you only consider total hits per second without considering pinned sessions.
Here’s where things become dangerous: queue depth. Yes, even though your pool has plenty of aggregate capacity, when a burst hits harder than any individual backend can handle, you’ll begin to drop requests. Consider an example spike of eighty requests within half a second. Your system may sustain only a fraction of that as an average load, but they could all hit just three backends before next cycle begins. With finite concurrent slots per backend, what happens to the rest? They wait in queue. The tool measures this pressure by measuring the ratio of your defined worker limits vs. This is your burst size. Is that surge absorbable without latency spikes? Or will it force you to drop those requests?
Testing for average throughput is straightforward. But testing how your pool copes with sudden rainstorms of traffic demands planning for worst-case alignment. The reference tables on the page lay this out neatly, especially the comparison between application-layer balancing and DNS round robin. DNS rotation is imprecise. Resolvers cache entries for minutes or hours. Traffic distribution also depends on TTL settings and where clients are located. This is cheap though. Application level round robin (e.g. Kubernetes services, NGINX) responds in near-realtime based off health checks. It skips nodes immediately if one goes down. Fairness? Yep. Dependency on your balancers’ performance? Yes.
Don’t view “backend count” as just a number. More nodes reduce per-node load, but they add more moving parts to manage in failure cases. With two nodes, you have half capacity if one fails. With ten nodes, there is only a ten percent hit if one goes down. You could of thought of that tradeoff in terms of staying up through partial failure, rather than just capacity at peak load. The tool gives you a way to see what happens when you remove a failed node and the remaining share gets redistributed. This isn’t a simple matter of scaling linearly. There are bottlenecks based on concurrency, which means non-linear behavior. Intuition is often mistaken here; people think it’s all linear when it isnt.
Last but certainly not least, round robin is a beginning. It is not an end. Once you have symmetric workloads it gives you some basic sense of fairness. The moment you have heterogeneous hardware, sticky sessions, or variable duration requests, you’ll want to measure the drift. Simulate your best case with the tool. Then spike the burst size. Add more nodes. Increase the keepalive rate. See where the margin goes away.
You don’t care about perfect distribution. You care about predictable failure. You want to know when it’s going to break down and why so that when things go wrong, you know who to blame and what breaks first. That’s how you turn guesswork into strategy.