NAT Port Exhaustion Calculator
Estimate outbound NAT, SNAT, PAT, and masquerade port pressure from active clients, connection churn, TIME_WAIT holdover, destination fan-out, and public IP pool size.
Calculation breakdown
NAT capacity multiplies cleanly by public IP count, but destination concentration and TIME_WAIT behavior decide how much of that pool is actually reachable under churn.
| Platform or device | Typical range | Ports per public IP | Sizing note |
|---|---|---|---|
| Linux common default | 32768 to 60999 | 28,232 | Common on servers, containers, and many home lab NAT hosts. |
| Windows modern default | 49152 to 65535 | 16,384 | Smaller default pool; tune only when the network stack and firewall support it. |
| BSD style high range | 49152 to 65535 | 16,384 | Often seen on routers, firewalls, and NAS-derived appliances. |
| Expanded Linux range | 1024 to 65535 | 64,512 | Large pool, but keep reserved ports and service listeners out of the allocator. |
| Cloud NAT managed pool | provider assigned | varies | Check per-VM, per-destination, and per-public-IP limits separately. |
| Scenario | Traffic shape | Main NAT risk | Practical mitigation |
|---|---|---|---|
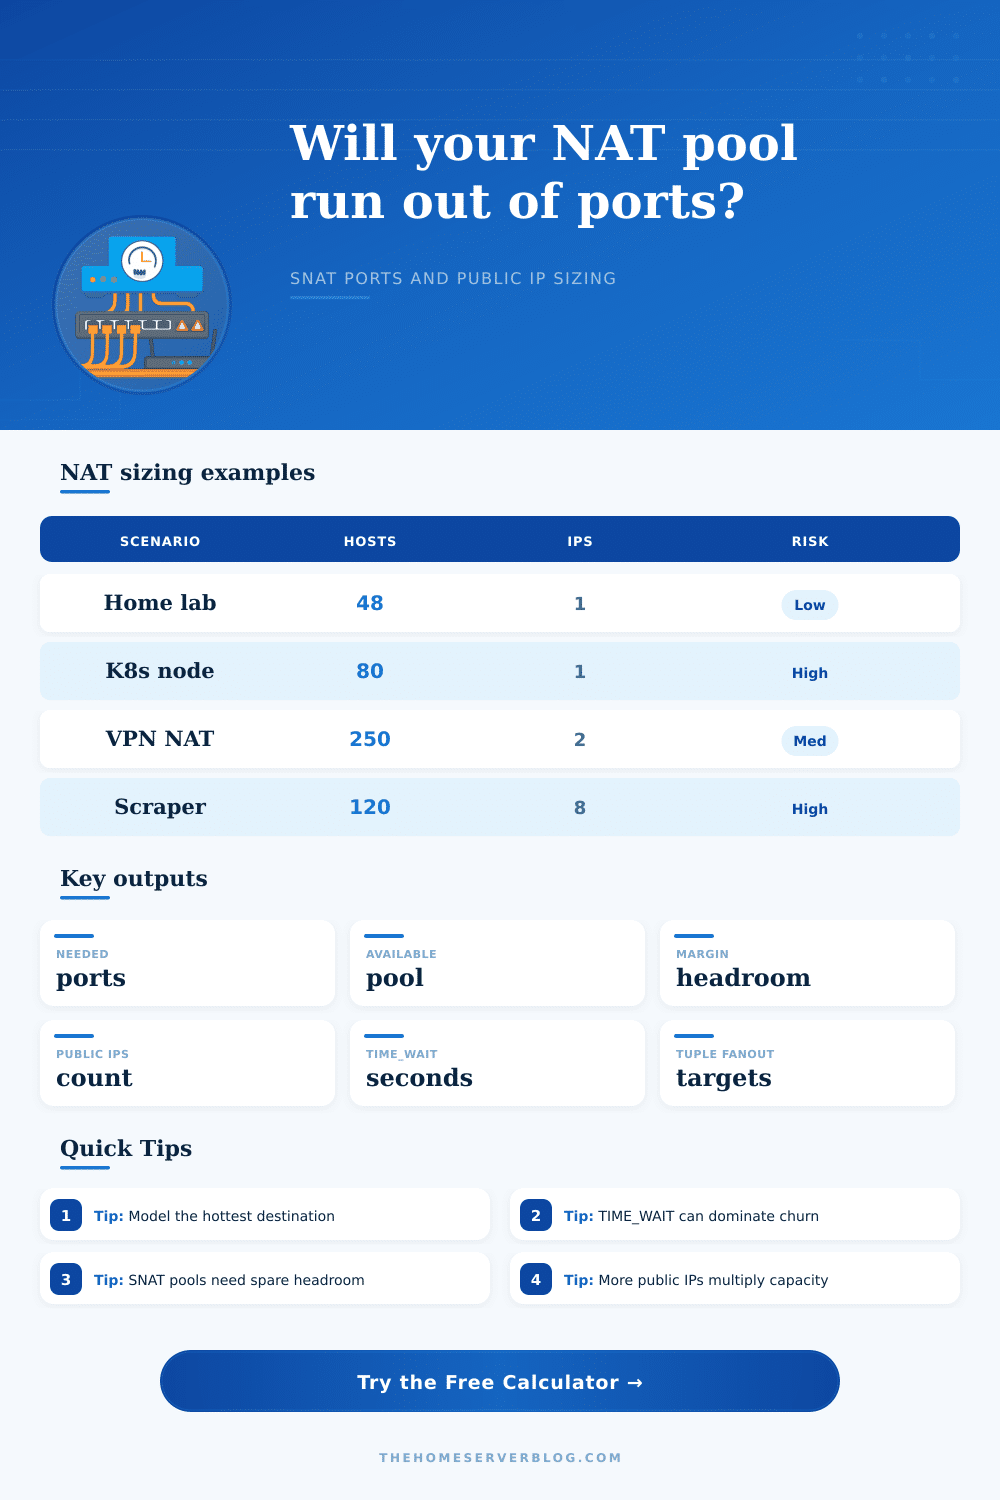
| Home Lab Outbound NAT | Browsers, package updates, DNS, media apps | Usually low unless downloads retry hard | Keep default range broad and watch connection tracking. |
| Kubernetes Node SNAT | Many pods behind one node IP | Hot service endpoints consume per-tuple ports | Use more node egress IPs or reduce SNAT concentration. |
| Office VPN NAT | Many users tunneled to SaaS and web apps | One public IP can mask hundreds of clients | Split pools by user group or add public IPs. |
| Web Scraper Pool | Short connections, repeated same targets | TIME_WAIT and target concentration dominate | Reuse HTTP sessions and spread destination tuples. |
| CI Runner Farm | Burst package downloads and registry pulls | Many parallel short TLS sessions | Add caches, mirrors, and egress IP capacity. |
| New connections/sec | Hold time | TIME_WAIT | Occupied port slots |
|---|---|---|---|
| 20 | 10 sec | 60 sec | About 1,400 before buffer |
| 100 | 5 sec | 60 sec | About 6,500 before buffer |
| 250 | 2 sec | 120 sec | About 30,500 before buffer |
| 800 | 1 sec | 60 sec | About 48,800 before buffer |
| Destination tuple count | What it means | Capacity effect | When to use it |
|---|---|---|---|
| 1 | One remote IP, port, and protocol | Worst-case port ceiling | Single API, registry, game server, or proxy target. |
| 5 to 20 | A small set of busy services | Moderate reuse of source ports | Home lab, office SaaS, CI with a few registries. |
| 50 to 500 | Broad web browsing or mixed destinations | Large effective pool | General user web traffic with many remote endpoints. |
| Measure from logs | Count hot remote tuples at peak | Best operational estimate | Firewall state tables, conntrack, VPC flow logs, or NAT logs. |
Maybe you’re having trouble on the internet: Packets is getting dropped for no apparent reason. Your speed test looks fine but your video call is glitchy and your web page times out with some generic error. The issue was always there, it just wasn’t noticeable enough yet.
You’ve exhausted your available ports. A router running Network Address Translation only have a limited number of temporary source port that get mapped to their public destination. Once those run out, your traffic stops too. It’s simple math, one that is hard for network admins to grasp since they figure the solution is just to throw some more bandwidth at it. But throwing more bandwidth isn’t going to help if there are no ports left to open any new TCP connection. You’ve got all your port combinations being used up by old requests.
How to Calculate Your Port Limits
All the calculator asks you to do is specify your number of client, the rate at which those clients make connections, how many public IPs you have in your pool, and it figure out the rest. No need for guessing when you’re near a complete outage or whether you’re good enough to get through peak load.
And the worst part? The number of client connection isn’t nearly as bad an input than connection duration. Specifically, it is length of time a connection stays alive even when closed. To prevent packet mis-mixing, TCP use a state called TIME_WAIT where it’ll keep a port open for some number of seconds (typically sixty) to handle any last minute packets that may arrive.
In cases of low connection churn, this won’t matter much but if you’re doing something with lots of short-lived connections, like running CI/CD jobs or scraping websites, then your TIME_WAIT can be a capacity killer. Those closed connection aren’t using the bandwidth, but they are taking up seats at table. That’s where the tool prompts for churn rate vs. Concurrent host: It assumes you may need room for currently-active connections, but also wants to know about inactive ones still tying up ports by keeping them open for TIME_WAIT.
Raw volume isn’t everything; destination concentration is also a major factor to watch out for. What happens if you hit the per-tuple limit because all your traffic go to the same server IP and port? You’re toast. The only difference between flows now is their source port. When you’ve burned through all 64k of those on a given remote endpoint, no matter what free space you might have left over for other destinations, the operating system simply will not accept more connections. Using HTTP keepalives, or spreading traffic out across different target IPs, can help ease this kind of tuple-churn pressure without requiring additional public addresses.
The second way to grow your port pool is through public IP addresses. Every time you get an IP it’s like starting over again with a fresh set of 64k ports. That’s why cloud providers tend to offer NAT gateways where you can use multiple egress IPs. And no, I don’t mean to spread out the load or provide redundancy in a traditional sense. This is to increase size of the state table. As seen on the page, different platforms has different ephemeral range sizes. Some appliances are just plain Windows while others default to Linux. Know what your hardware support before assuming you can hit an arbitrary number that your hardware won’t let you reach.
Capacity = (worst-case scenario) / (size of NAT). You don’t need a pool that works during quiet condition. It must also survive under the worst case. This means surviving huge package update cycles. It also means surviving the surge from apps opening thousands of short-lived connections without trying to reuse existing sockets. Finally, it means surviving retry storms from hashing collisions.
The only way to add a safety buffer is to account for this in your sizing. The calculator gives you a margin on the end result, which tells you just how far from breaking point you are. The ideal is to be safely beneath the ceiling. You’d like enough spare ports so as to never reset connections due to a sudden rush of traffic. Better to have a bit more (ephemeral range, or public IPs) than find yourself debugging occasional connectivity problems that are hard to pin down.
Once you understand what causes port pressure buildup. Due to both destination concentration and churn, you can size things correctly as a routine part of network engineering. The packets flow freely, the network remains stable, and those pesky mysterious outages where everything seems ok and then it just doesn’t work get eliminated. Actualy, the packets flowes freely, the network remains stable, and those pesky mysterious outages where everything seems ok and then it just doesn’t work gets eliminated. You should of checked this earlier. It was more difficult than I thought because the connection duration is more important than client numbers. If you want to avoid issues, you should of looked at how many ports dissapears.