Database read scaling planner
Read Replica Count Calculator
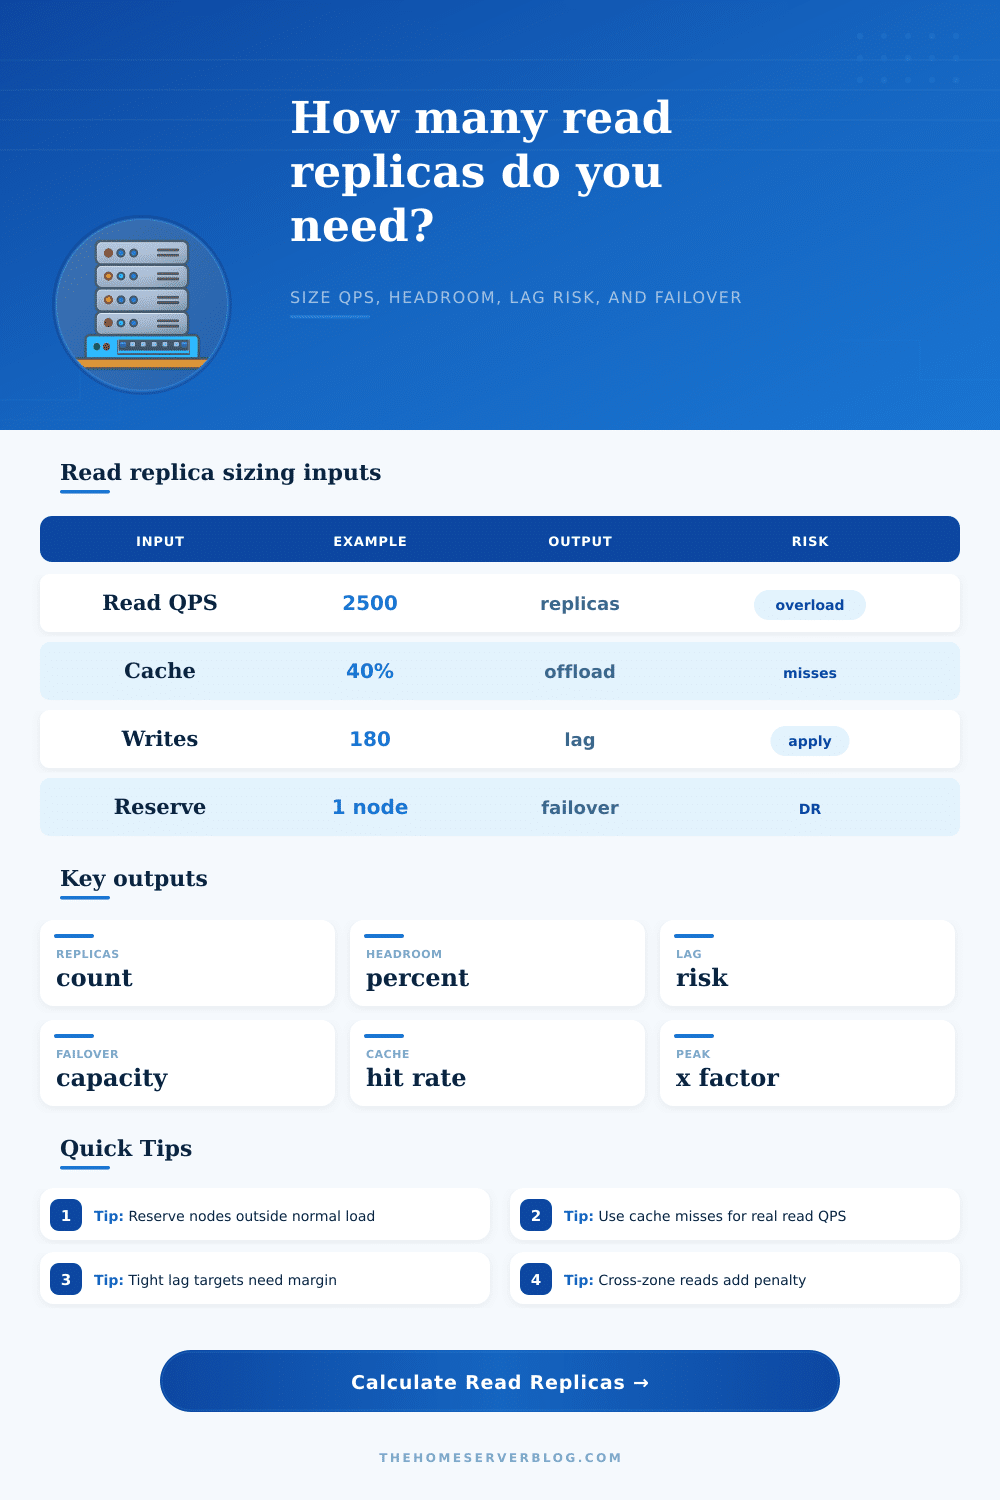
Estimate how many read replicas a database pool needs after cache hits, peak traffic, primary read budget, replica capacity, write pressure, replication lag target, cross-zone latency, and failover reserve.
Live sizing labels
PostgreSQL Reporting keeps a reporting reader pool away from the primary while reserving one replica for maintenance or failover.
Replica sizing breakdown
Lag and failover pressure
PostgreSQL streaming
Physical replicas are strong for hot standby reads, HA, and reporting. Watch replay delay, long queries, vacuum conflicts, and synchronous commit latency.
MySQL async replicas
Read pools are common for web workloads. Size for single-threaded apply limits, replica filters, binlog retention, and Seconds_Behind_Source accuracy.
Aurora or cloud readers
Managed readers simplify scaling but still need endpoint routing, promotion capacity, replica lag alarms, and per-instance class read limits.
WordPress offload
Object cache and page cache often remove more load than replicas. Use replicas for uncached admin, search, archive, and reporting reads.
Analytics readers
Dashboards need larger headroom because scans, sorts, and stale statistics can reduce practical QPS far below OLTP lookup capacity.
Multi-AZ disaster recovery
Reserve replicas are capacity insurance. Keep at least one promotable node outside routine read load when RTO and maintenance matter.
| Sizing term | Formula used | Why it matters | Planner note |
|---|---|---|---|
| Effective read QPS | Read QPS x peak x cache miss | Only cache misses need database read capacity. | Use production miss rate, not ideal cache hit rate. |
| Primary read budget | Primary capacity minus write tax | Writes, checkpoints, locks, and autovacuum reduce safe read room. | Protect the primary before adding reader traffic. |
| Safe replica capacity | Replica capacity after latency and lag tax | Cross-zone hops and apply pressure reduce useful reader capacity. | Use sustained QPS from load testing. |
| Total replicas | Serving replicas plus reserve | Reserve nodes keep service stable during failover or maintenance. | Do not count reserve as normal read pool capacity. |
| Read pattern | Typical cache hit | Replica behavior | Risk to monitor |
|---|---|---|---|
| API entity lookups | 40% to 85% | Many small indexed reads scale cleanly across replicas. | Connection pools and hot keys. |
| WordPress public pages | 70% to 98% | Database readers mostly handle logged-in and cache-miss traffic. | Admin queries and search bursts. |
| Reporting dashboards | 0% to 40% | Fewer heavy reads can consume whole replicas. | Sorts, scans, temp files, and stale replicas. |
| Tenant SaaS reads | 20% to 70% | Shard or tenant skew can leave one reader hotter than average. | Noisy tenants and uneven routing. |
| Lag risk band | Lag target utilization | Capacity posture | Action |
|---|---|---|---|
| Low | Under 70% | Replica apply and network have healthy margin. | Keep alarms and review after traffic changes. |
| Moderate | 70% to 120% | Short bursts may breach the staleness target. | Add headroom, relax target, or reduce heavy reads. |
| High | Over 120% | Replicas may serve stale data or fall behind writes. | Add replicas cautiously and improve apply throughput. |
| Critical | No positive headroom | Reads exceed safe capacity during the modeled peak. | Cut cache misses, increase capacity, or split workload. |
| Failover reserve | Use case | Capacity meaning | Practical check |
|---|---|---|---|
| 0 replicas | Lab, noncritical reporting, disposable readers. | All replicas serve normal reads. | Expect reduced capacity during maintenance. |
| 1 replica | Small production, WordPress, API read scaling. | One node can fail or be promoted without full read outage. | Confirm remaining readers cover peak misses. |
| 2 replicas | Multi-AZ HA, SaaS, larger dashboards. | One node can be isolated while another stays promotable. | Balance routing so reserve stays cool. |
| 3+ replicas | Regional DR, launch events, compliance windows. | Reserve is a separate reliability pool, not just spare QPS. | Test failover and read-only endpoint changes. |
So you add a replica because the primary is slow … but then that replica lags behind too! Why do they make it seem like a punishment for doing the right thing?!? This isn’t typically a matter of raw compute power. It is a matter of delays in copying data and increased write volume. Those two force quietly consume your capacity without you realizing until queue begins filling up.
To size your read replicas correctly, you need to get beyond the headline query count. You need to understand what actualy goes over the wire between your primary and its followers. To be fair, most teams begin with request counts, which is deceiving when they’re running with caches. Once you enter your cache hit-rate into calculator (above) it does the math for you. No need to guess at conversions and coefficients.
How to Size Your Database Replicas Correctly
Redis or your CDN is taking up 40% of your traffic? Great! Those requests will never reach database engine. Only the ones that slip past to the back end constitute the “misses”, the ones you actualy need to provision for. Over-provisioning occurs when you don’t account for this. In that case, you’re paying for server time spent idling as it waits for queries that were already answered by memory layers nearer to the user, this is a classic budget leak in infrastructure planning at an early stage.
Complicating the picture are writes. Every write transaction that occurs on the primary needs to be applied on all the replicas. Applying this work takes IOPS and CPU from the replica. Because they’re applying these writes, there’s less of those resources available for serving actual read queries. If your workload involve a lot of writing, then one of your replicas could end up spending more time trying to catch up than it does serving user requests.
To account for this, the tool will let you know about how much write pressure is in play and how much of each replica’s resources are already being consumed by syncing. What remains is your budget for running your API loads/reporting/etc. This also explains why adding replicas can sometimes result in diminishing returns: the cost of keeping them in sync eventually exceeds the benefit of spreading out your read load.
There’s yet another dimension of friction: cross-zone latency. Because readers may sit within their own availability zones, the replication stream must travel across network hops which add milliseconds of latency. And during times of high throughput, those delays multiply. They cause temporary lag spikes that violates strict consistency guarantees. Physical distance simply isn’t something you can dismiss when estimating your safe capacity limits. That’s why the page’s reference table show how effective throughput decreases with rising latency penalties.
For some applications; reporting dashboards, a few seconds of lag may not matter. But for others, inventory checks or financial transactions… You’ll want stricter controls and extra headroom to absorb those network jitters without being left in the dust.
While averages are useful for sizing, they’re also misleading because a database won’t crash on a slow day. It will collapse under bursty loads: viral posts, end-of-month closings, or Black Friday sales. The mean can be sustained, but spikes shows if there is enough buffer capacity by revealing any holes instantly. Size for the spike, not the mean.
To simulate this condition of stress, the calculator uses a peak traffic multiplier against your base query rate. That way your replicas has headroom to absorb short-term surges while avoiding overloading the primary and causing a chain of timeouts. It makes you face facts, instead of optimizing for a calm, ideal world which never happens in production.
Many people think of failover reserve capacity as an “optional” optimization, don’t make that deadly error. If all your replicas are busy serving reads, you have no spare node ready to take over if the primary fails. All your replicas happen to be busy answering read requests. Now you promote a reader… Uh-oh! Your system goes down while this replica waits out whatever work it’s doing and catches up on pending updates.
To avoid that, keep at least one replica on standby for emergency promotion so that you can transition smoothly during outages. Yes, that reserves some nodes that sits there silently except when disaster hits. But it’s also an insurance policy against unplanned downtime; and that’s worth something.
These tradeoffs make scaling databases an engineering problem rather than a guessing game. You begin to solve the source of contention and latency instead of throwing hardware at your performance problems. The same rules apply whether you’re using MySQL, PostgresQL, or a managed cloud service: plan for the worst case, respect the cost of replication, and protect the primary. Balancing these competing demands are essential to the stability of your application if traffic inevitably spikes.