Scaling Cooldown Calculator
Estimate a practical autoscaling cooldown from metric period, warmup, scale-in cooldown, traffic ramp speed, per-instance capacity, target utilization, replica bounds, stabilization window, and queue drain time.
Cooldown Breakdown
Autoscaling Pressure
Metric Freshness
Cooldown should cover at least two metric periods when metrics are averaged or delayed. Otherwise the next scale decision can reuse stale pressure.
Warmup Visibility
New replicas need time to pass readiness, fill caches, connect pools, and receive traffic before the autoscaler judges their effect.
Ramp Capacity
Fast traffic ramps reduce the safe upper bound for cooldown because demand can grow by one replica before the next decision arrives.
Queue Masking
Backlog can make a falling workload look busy. Scale-in should wait long enough for queue drain and recommendation history to settle.
| Preset | Good starting cooldown | Replica pattern | Watch first |
|---|---|---|---|
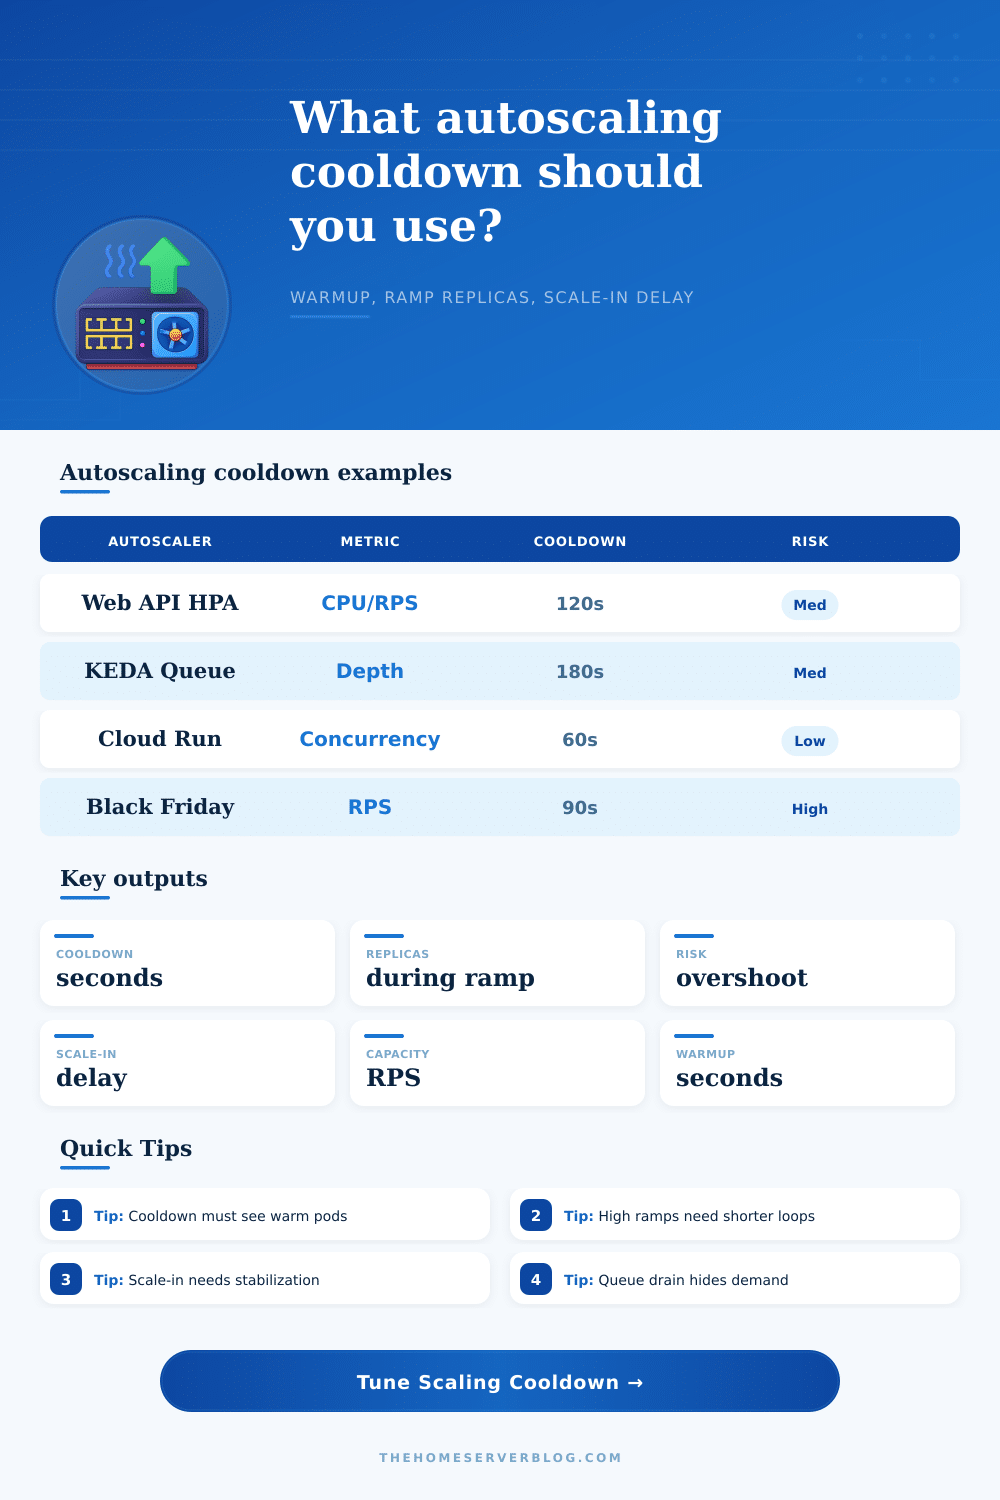
| Web API HPA | 60 to 180 seconds | Small steady pool plus burst pods | p95 latency, CPU smoothing, readiness delay. |
| Queue Worker Autoscale | 120 to 360 seconds | Wider scale-out with slow scale-in | Backlog age, retry storms, broker prefetch. |
| CPU Burst VPS | 45 to 120 seconds | Few replicas and tight CPU headroom | CPU steal, thermal throttling, load average. |
| KEDA RabbitMQ | 90 to 300 seconds | Queue depth driven workers | Activation threshold, drain time, max replica cap. |
| Black Friday Spike | 30 to 120 seconds | Rapid scale-out, conservative scale-in | Cold starts, database pool, cache fill, upstream quotas. |
| Input | What it changes | Higher value means | Cooldown effect |
|---|---|---|---|
| Metric period seconds | Freshness of the next recommendation | Older or smoother signal | Raises minimum cooldown. |
| Scale-out warmup seconds | When added replicas become visible | More cold-start and readiness lag | Raises observation floor and overshoot risk. |
| Traffic ramp %/min | Demand growth between decisions | Capacity gets stale faster | Lowers safe upper cooldown. |
| Target utilization % | Usable RPS per replica | Less headroom per replica | Can raise replicas during ramp. |
| Stabilization window | Scale-in dampening | More downscale patience | Raises scale-in delay. |
| Formula piece | Calculator logic | Why it matters | Practical note |
|---|---|---|---|
| Target RPS per replica | capacity x target utilization | Converts service capacity into autoscaler demand | Use sustained RPS, not a benchmark peak. |
| Metric floor | 2 x metric period | Requires at least one fresh follow-up sample | Shorter loops often double-act on stale data. |
| Warmup floor | warmup + metric period | Lets new capacity show up in metrics | Readiness probes and cache fill belong here. |
| One-replica growth time | compound ramp time to add one replica of demand | Caps cooldown during fast ramps | Small min replica counts are most sensitive. |
| Scale-in delay | max(scale-in, stabilization, queue drain) + metric period | Prevents capacity removal while backlog or history is still high | Usually longer than scale-out cooldown. |
| Overshoot band | Score | Typical cause | Recommended action |
|---|---|---|---|
| Low | 0 to 34% | Warmup and metrics fit inside cooldown | Keep current loop and validate with p95 latency. |
| Medium | 35 to 64% | Warmup, queue drain, or ramp is close to timing limit | Increase stabilization or lower target utilization. |
| High | 65 to 84% | Cooldown is short relative to warmup or backlog | Add scale-out policies, prewarm, or cap step size. |
| Critical | 85%+ | Fast ramp plus stale metrics and delayed capacity | Pre-scale, raise max replicas, and protect dependencies. |
That can result in a big increase in response time for your API due to the resulting traffic spike. Your new pods is waiting to download their images as your load balancer rejects requests. Even though the autoscaler looks like it’s working correctly, it’s moving too slow and doesn’t help.
Now cooldown tuning isn’t as simple; it’s complex, as you need to weigh how fast you want it to react versus how much you don’t want it to overreact. The problem is that the feedback loop have a delay. Your app doesn’t get immediate visibility into what’s happening. Should it decrease its requests once CPU goes up? How can it tell whether this is a one-off spike or some kind of long-term trend? Your app must have a little bit of time to check if signal is legit.
How to Tune Your Autoscaler Settings
Set your cooldown time too low, and you’ll flap: your replicas will spin up and shut down because the metric fluctuate slightly. That burns money, wastes resources, and messes with other parts of your system. Set your cooldown too high, and you leave idle server sitting around doing nothing while your users twiddle their thumbs. The page includes a calculator for figuring out the sweet spot given your particular traffic pattern and warmup time.
The other place that people get it wrong is in the warmup. Just because a new container has transitioned from Running doesn’t mean it’s ready for action. It still needs to register with the service mesh. It needs to establish connections to the database, populate the cache, and pull down the image. In the meantime, it isn’t visible to load balancer. This means that if your warmup takes longer than your cooldown then by the time the autoscaler sees the impact of the scale-out event, it will trigger yet another. It thinks there was a failure so it adds more. You end up overshooting, which means you have more pods than you need, wasting compute hours and increasing costs.
It’s all about the change in speed of the traffic ramps. If your traffic increases gradually through the morning, then you can afford a longer cooldown period, since you’ll be able to steadily ride along the demand curve. But if your traffic doubles every minute with a flash sale or viral post, then the loop needs to tighten up. Double your traffic every minute and you’ve only got two minutes before the spike is over. By then, you are past being able to respond in time.
How quickly does enough demand come in for one replica? Use that as your max scale-out cooldown. Anything more misses the spike altogether.
Scale-in is more of a patient process that take a bit longer. You’re not supposed to remove it fast. The queue depth may stay high long after there are no new incoming requests, hiding the actual load. Then if you scale down as its clearing out, you risk having no workers left when the last late request finally comes in. Stability windows keep things stable so that we don’t do that. We need to make sure that the system stays calm for an extended amount of time before removing anything. Better to have slightly too much capacity for 10 minutes than to crash your service because you trimmed fat too aggressively.
On the page it also has a reference table to show what kinds of workloads can tolerate what kind of risk. For example, maybe batch processing jobs are more forgiving different than a web API. Queue driven systems have buffers between them and their demand and generally scale in after waiting long enough for their queues to drain organically; this is another reason they’ll require longer delays to scale in. Being able to intuitively understand these patterns will help you pick presets based off your own architecture rather than just blindly picking one.
There’s no such thing as the right number when tuning autoscaling. Tuning autoscaling is all about making tradeoffs. No matter what you do, you’re going to have some lag between your demand and your capacity. Aim to keep this lag at a point where your cost is reasonable yet your users aren’t feeling any large amount of pain. Start by assuming conservative numbers, put those numbers to the test under load, then tune based on what you learn.
Monitor your p95 latency across scale events. Spikes in that metric mean your warmup might be underestimated, or maybe your cooldown is too long. Constant replica churn means you’re too aggressive. Which brings me to the point: metrics are a snapshot of a moving target. What’s important is knowing which one. How quickly does it take to snap the picture? To turn the data into an action? Build that into your config. Then your settings will feel less arbitrary, because you’ll understand how much delay there is between the two.
You’ll begin to think about your system not as something that triggers an alarm, but as having a rhythm. That’s when scaling becomes not just a chaotic event, but a process you can control.