Home lab bucket capacity planning
Object Storage Cost Calculator
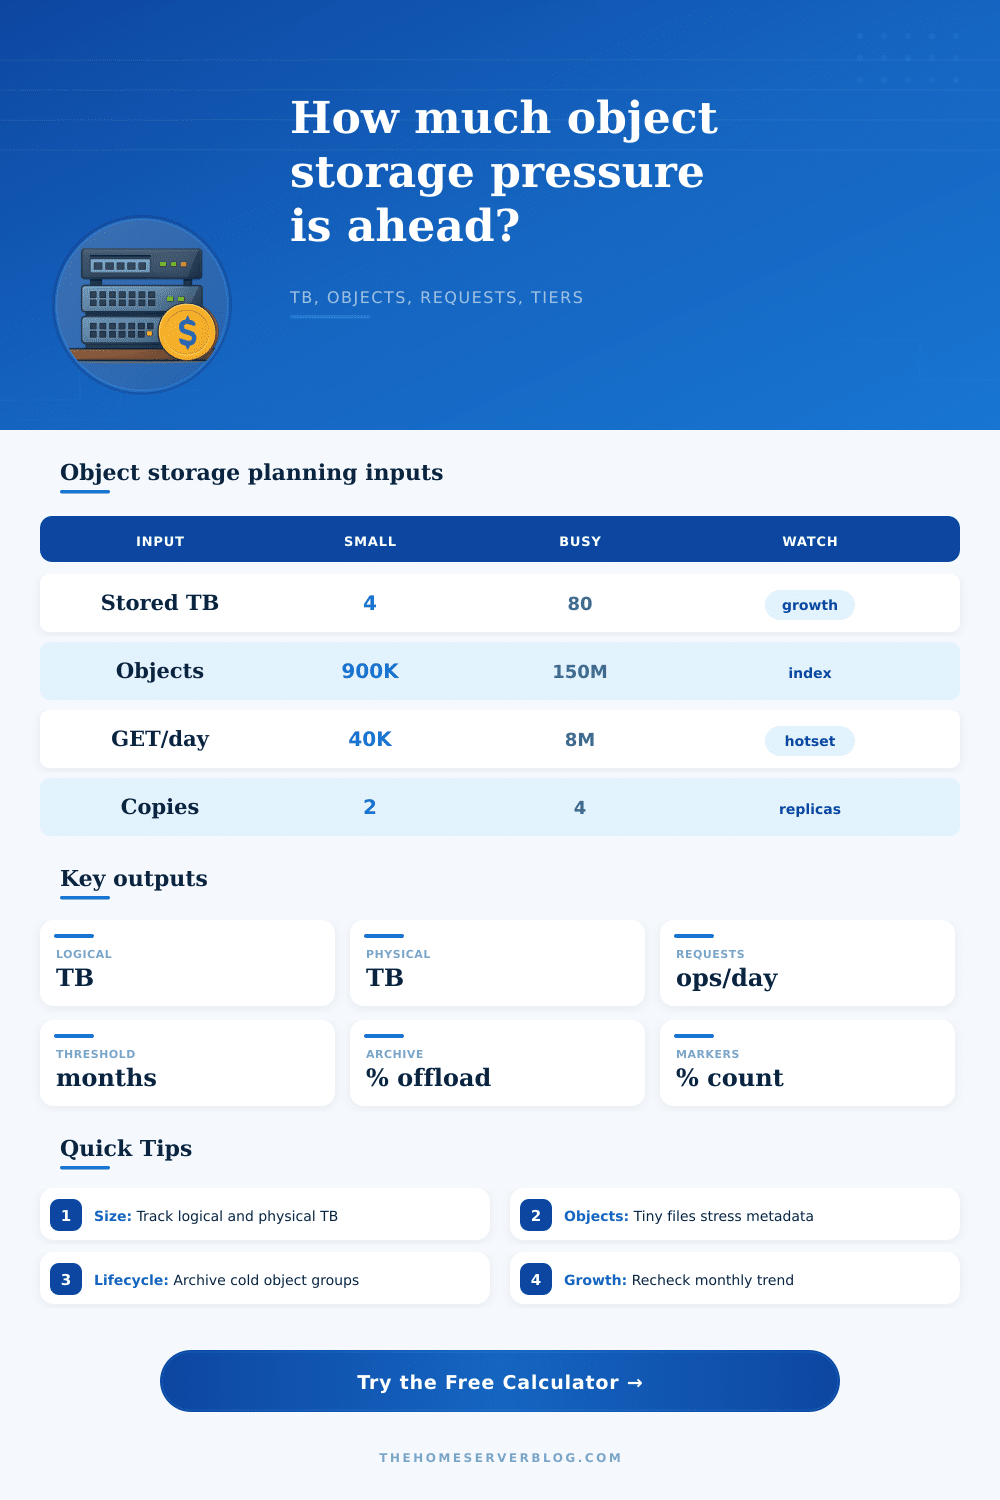
Estimate the capacity pressure behind object storage growth: logical TB, physical TB after copies, daily request operations, lifecycle archive offload, delete marker overhead, and months until a threshold is reached.
Storage pressure breakdown
Request and metadata load
Hot Object Tier
Designed for frequent reads, thumbnails, downloads, sync clients, and active application paths.
< 30 daysCool Object Tier
Useful for older media, backups with occasional restores, replicated logs, and lower read frequency.
30-90 daysArchive Object Tier
Best for retention sets, camera clips, raw exports, compliance logs, and rarely restored data.
90+ daysMetadata Hotspot
Large counts of tiny objects can stress listing, indexing, lifecycle scans, and delete cleanup.
< 1 MB avgObject Density
< 1M / TBHigher density deserves lifecycle batching, prefix planning, and metadata monitoring.
Write Mix
< 25%Write-heavy buckets need ingest queues, multipart tuning, and cleanup schedules.
Version Expansion
< 1.0 copyNoncurrent versions grow quietly unless retention windows and expiration rules are reviewed.
Growth Window
6+ monthsKeep enough runway for disks, nodes, erasure sets, or migration work to arrive calmly.
| Workload | Typical object size | Common request shape | Capacity risk to watch |
|---|---|---|---|
| Photo archive bucket | 4-25 MB JPEG or RAW sidecars | Read bursts during gallery browsing and imports | Versioned edits and thumbnails expanding physical TB |
| Backup repository | 8-128 MB chunks | Scheduled PUT bursts with periodic restore GETs | Retention windows keeping old chunks longer than expected |
| Static website assets | 20 KB-4 MB | Heavy GET load with low PUT load | Millions of small files stressing metadata and cache invalidation |
| Log archive bucket | 1-256 MB compressed bundles | Continuous PUTs, rare GETs, lifecycle transitions | Index partitions and incomplete expiration rules |
| Container registry blobs | 5-250 MB layers | CI pulls, pushes, manifest reads, garbage collection | Untagged layers and duplicate architecture builds |
| Lifecycle rule | Good trigger | Calculator field affected | Operational note |
|---|---|---|---|
| Move cold media | No read for 60-180 days | Lifecycle archive percent | Keep preview thumbnails hot when the original can be cold. |
| Expire noncurrent versions | Version age or count limit | Versioning copies per live object | Set a retention rule before edit-heavy buckets multiply. |
| Delete marker cleanup | Expired object delete markers | Delete marker percent | Cleanup prevents listings from becoming harder to reason about. |
| Abort incomplete uploads | Multipart age over 7-30 days | Stored data now TB | Incomplete uploads can hide in backend capacity views. |
| Archive raw logs | Daily or monthly partitions close | Lifecycle archive percent | Transition whole partitions to avoid mixed hot and cold prefixes. |
| Request pattern | GET/day signal | PUT/day signal | Planning response |
|---|---|---|---|
| Read-mostly website assets | Very high compared with object count | Low and deployment-driven | Use cache headers, compact assets, and watch hot prefixes. |
| Backup ingest window | Low except restores | Spiky during scheduled jobs | Spread jobs and monitor multipart completion backlog. |
| Sync application store | Steady from clients | Steady from edits and uploads | Watch version growth and small-object churn. |
| Data lake raw zone | Batch scan reads | Batch ingest writes | Partition by date, source, and scan pattern. |
| Registry blob cache | CI and node pull waves | Build pipeline push waves | Schedule garbage collection and deduplicate base layers. |
| Capacity pressure | Early sign | Threshold action | Calculator output to watch |
|---|---|---|---|
| Replica expansion | Physical TB much larger than logical TB | Review replication or erasure profile | Logical vs physical TB |
| Version sprawl | Old object versions exceed live payload | Expire noncurrent versions by age or count | Version TB and physical TB |
| Metadata pressure | Listings, lifecycle scans, or sync walks slow down | Shard prefixes or compact tiny objects | Total metadata entries |
| Cold tier mismatch | Hot tier stays large after lifecycle policy | Move more inactive object groups | Lifecycle offload percent |
| Growth runway | Capacity line arrives inside one planning cycle | Add nodes, split bucket, or reduce retention | Months to threshold |
Most folks use object storage as a sort of black hole. You begin by throwing some photos into a bucket and end up with a fully formed data lake. In between, it is treated as an infinite black hole. Throw your files in there, then don’t think about them again until the disk space run out or the bill comes due. For a week, this is fine. Under its own weight, this will collapse.
Why? Because it doesn’t take into account how storage work. What is it that you’re measuring? How many gigabytes do you have? Sure. But more importantly, how do those bytes act, grow, and require your backend systems attention?
How to Plan Your Storage Space Wisely
Once you know your growth rate and current payload (which the calculator above does for you), you don’t need to guess at any hidden overheads or coefficients; it does math for you. Initially most users will input their logical storage size, what their files actualy appear as when looking around in their file explorer. If you’re replicating or using versioning then this isn’t true. Replication mean every node has a copy of everything. This multiplies your physical footprint. Every edit generate another version of that file, which stays behind as a copy until it time out.
It’s why so many people suddenly “run out of disk space” without realizing, there’s one thing you’re not considering: the difference between those two number. Ignore that difference and you’ll soon be running out of disk space. You may think you’ve got loads of room, but your back end is already choked with invisible copies, delete markers etc…
The second type of pressure comes from tiny things that don’t relate at all to raw capacity. A bucket full of thumbnails (a million one kilobyte images) would really clog the system compared to a bucket full of video archives (ten gigs worth), despite equal storage usage, due to the expense of metadata operations. Here’s where request count inputs becomes important: read operations add up very fast when you have a bunch of health checks or syncs happening every few seconds. Is it write-heavy? Read-heavy? Mostly idle? What is the workload like? A container registry with constant pushes and pulls as containers are built looks quite different than a static website.
Before reaching capacity limits, the primary lever for controlling costs is lifecycle policies. Lifecycle policies is used here. Cold data gets moved into cheaper archive tiers, reducing the amount of pressure on hot storage nodes immediately. By selecting a retention strategy, the calculator will estimate how many files can be archived so that active tier remains fast enough to serve your current users while not being bogged down with old backups nobody ever restores. Clearly define your active and old prefixes so that lifecycle rules can target specific sets of datasets without accidentally taking out something that’s still in use.
Until we reach a wall, growth feels like a straight line. Seven percent each month isn’t too bad… then compounding growth hits and the speed pick up quickly. The tool tells you exactly when you’ll reach your capacity limit so you can adjust retention policies or plan for expansions before it’s too late. Emergency buys & frantic cleanup scripts is a sign that you’ve run out of runway. You should of planned in advance so you can calmly buy more shards/nodes instead of scrambling because your dashboard is flashing red.
The other silent killer: Version sprawl happen quietly, and unless there’s strict expiration rules, it just builds up over time. For example, a photo archive that keeps all edits as a separate version doubles its physical space in months. How many copies? The calculator counts them up so you see how much your versioning really costs in terms of real physical storage. Check these options occasionally to avoid having all your space eaten up by quiet growth.
This is the bottom line. Capacity planning is visibility. If you can’t accurately see it, how can you control it? You can prevent crisis reactions and enable built-in stability by distinguishing between cold storage and hot requests, separating logical payload from physical reality, and predicting future growth curves. It’s not simply about storing more, but about storing it wisely. Don’t get caught up in logical illusions. Keep your eye on the physical metrics and your infrastructure won’t surprise you when it scales.