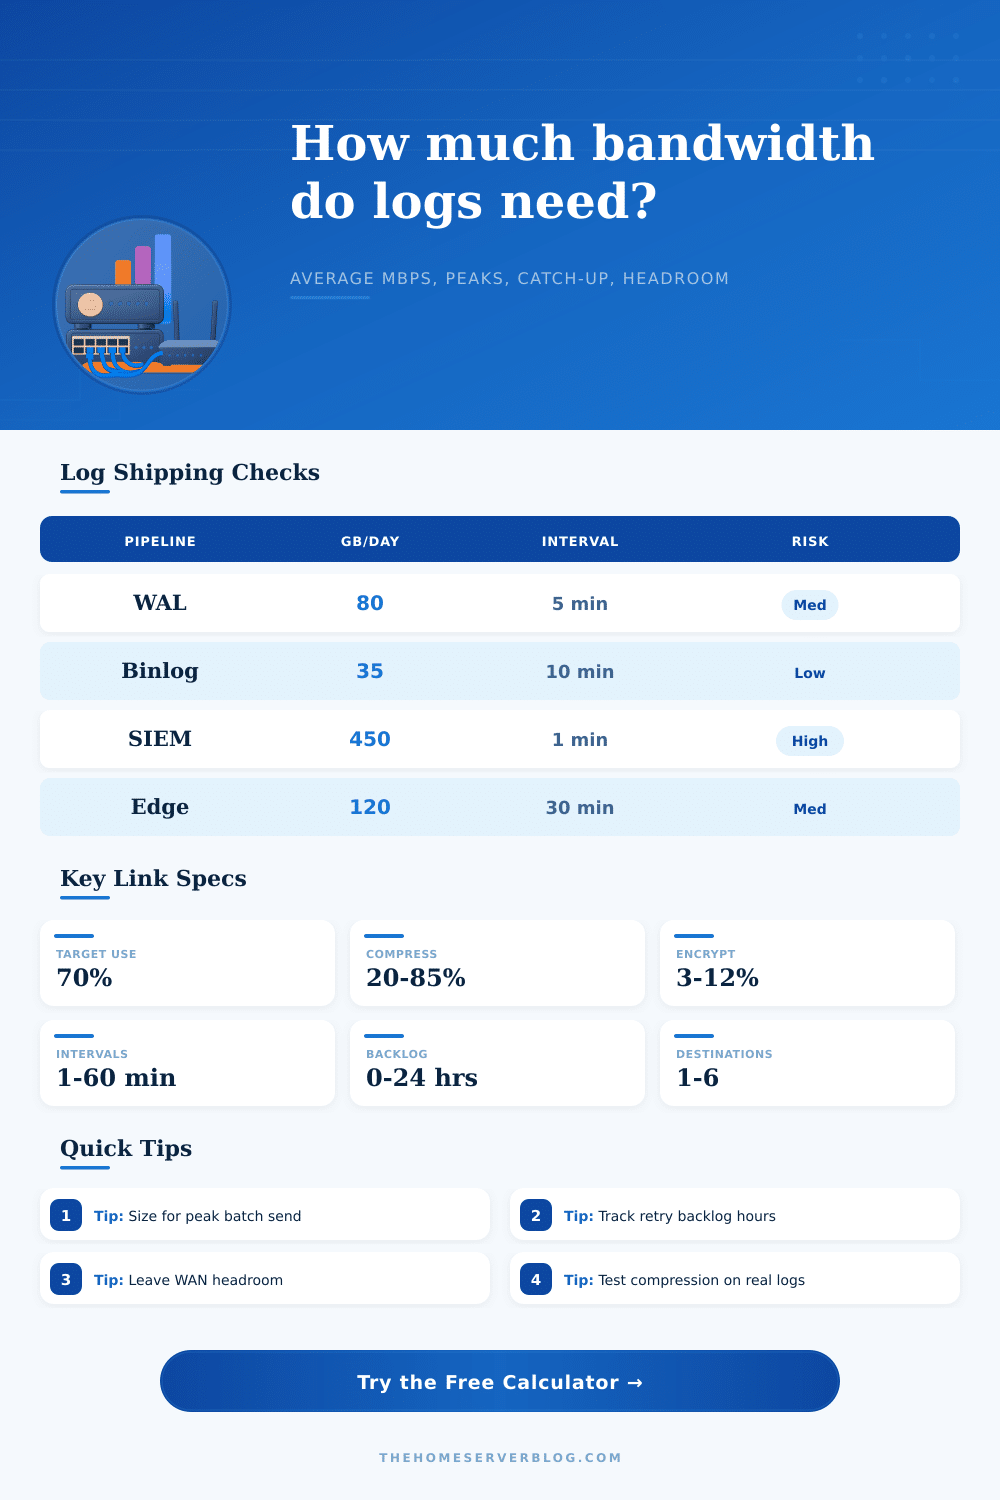
WAL, binlog, SIEM, audit, and archive links
Log Shipping Bandwidth Calculator
Estimate average Mbps, peak batch Mbps, retry catch-up time, and WAN headroom for database log shipping, event forwarding, security logs, and multi-destination archives.
Full log shipping breakdown
Average Mbps
Average Mbps = daily wire GB x 8000 megabits per GB divided by 86,400 seconds.
Peak Mbps
Peak Mbps applies the peak log multiplier, then assumes the batch clears during the active send window.
Catch-up time
Catch-up hours = retry backlog megabits divided by spare average Mbps after live log traffic.
Headroom
Link headroom = available Mbps minus peak Mbps. Negative headroom means intervals can stack up.
Planning target
Compression range
Control overhead
Retention guard
Database WAL shipping
Segments arrive in bursts and must clear before replica lag breaches recovery point goals.
Binlog replication
Transaction logs often compress well, but schema changes and bulk loads can reshape bursts quickly.
SIEM forwarding
Collectors fan out to multiple destinations and can see sharp spikes during scans or incident response.
Kubernetes audit flow
Control-plane events are small but spiky, especially during deploys, autoscaling, or policy changes.
Edge site archive
Small links may batch logs longer, so peak send windows matter more than the daily average.
Multi-region archive
Each destination multiplies bandwidth needs unless replication happens after the first landing zone.
| Log workload | Typical shape | Compression expectation | Bandwidth concern |
|---|---|---|---|
| PostgreSQL WAL shipping | Segmented database changes | Moderate unless WAL compression is already enabled | Replica lag during checkpoints, bulk loads, and vacuum-heavy periods |
| MySQL binlog replica | Ordered transaction stream | Moderate to high for statement-heavy logs | Large transactions can create long catch-up windows |
| SIEM log forwarder | Many sources through one collector | High for text logs, lower for packet metadata | Destination fan-out and retry queues during receiver throttling |
| Kubernetes audit logs | Small JSON events with bursts | High when batched before send | Deploys and autoscaling can multiply short-term log rate |
| Web access logs | Predictable daily peaks | Very high for repeated fields and paths | Traffic spikes and bot activity can dominate peak Mbps |
| Ack / replication mode | Wire overhead model | Active window model | Best fit |
|---|---|---|---|
| Async send, best-effort ack | 0% control overhead | 70% of interval can be used for transfer | Low-value debug logs, buffered archives, and tolerant forwarding |
| Receiver ack before delete | 5% control overhead | 56% of interval can be used for transfer | Most collectors, file shippers, and database archive commands |
| Synchronous replica confirm | 12% control overhead | 45% of interval can be used for transfer | Replica lag sensitive databases and recovery point objectives |
| Quorum multi-destination confirm | 25% control overhead | 38% of interval can be used for transfer | Multi-region compliance archives and durable security trails |
| Peak utilization | Interpretation | Action | Metric to watch |
|---|---|---|---|
| Below 50% | Comfortable headroom | Keep interval and retention settings | Replica lag, queue depth, send latency |
| 50-70% | Healthy planning range | Validate with real compression samples | p95 batch transfer duration |
| 70-90% | Tight during bursts | Increase compression, shorten payloads, or reserve more link | Retry count and link saturation time |
| Above 90% | High backlog risk | Reduce fan-out, increase capacity, or lengthen retention buffer | Oldest unsent log age |
| Shipping interval | Operational effect | Good use case | Practical note |
|---|---|---|---|
| 1-2 minutes | Small batches, frequent control traffic | Low-lag replicas and audit streams | Confirm receiver can handle frequent file opens or API calls |
| 5-10 minutes | Balanced batch size and lag | General home lab and small office log shipping | Good default when link quality is stable |
| 15-30 minutes | Larger bursts, fewer transfers | Edge sites and scheduled archive pushes | Peak Mbps matters more than daily average Mbps |
| 60 minutes or more | Large backlog chunks | Cold archive and off-hours transfer windows | Retention must survive a failed batch plus retry delay |
Log shipping can also fail, but usualy without fanfare or screaming red alarms. You just wake up to discover that your replica database hasn’t been refreshed in the last four hours, due to WAN link being jammed by unexpected backup traffic. Or maybe your SIEM collector drop events while running a security scan, thinking that the pipe was going to remain open. Log shipping bandwidth planning is an abstract concept until the pipe chokes.
So plan for worst-case scenario, the peak burst rate, to see if your link will survive in real world. To get a number, most admins begin by figuring out how many megabits per second they needs on average to transport their day’s worth of log volume. That provides a reassuring baseline. But it fails to take into account that log traffic doesn’t behave as if it’s water in a pipe flowing steady.
Plan for Peak Burst Traffic, Not Just Average Use
It comes in chunks. Your database writes out a chunk, compresses it, then ships it off all at once when it hits its shipping interval. You’re pushing PostgreSQL WAL files every five minutes? The network see a 5-minute spike every five minutes, then nothing. The calculator above will crunch the numbers and tell you how those spikes is different than your available link capacity.
Compression: Don’t count on any maximum theoretical value; text-heavy application logs and JSON audit trails can often shrink by 80 percent or more. Binary logs or encrypted traffic get little or no compression. This is one you should of tweaked the tool with after seeing how much it actualy compresses in your own environment. Under-estimating compression is better than over-estimating it.
Little or no compression for binary logs or encrypted traffic. This is one you can tweak the tool with after seeing how much it actualy compresses in your own environment. Under-estimating compression is better then over-estimating it. Protocol acknowledgements and encryption overhead add a few percent to each packet with TLS wrapping. Handshakes from synchronous replication modes consumes part of your transfer window. These little things add up fast when you’re trying to get a big batch through a small time slice.
Most designs breaks at peak. Your peak burst is ninety percent of your link’s capacity. Any small amount of background traffic or jitter will push you over the edge and time out with a retry. The table in the reference on the page make it clear: You want to stay under seventy percent peak to have some headroom for unexpected surges.
And if you’re increasing number of destinations (for example, replicating to several region for compliance), then you’re multiplying the required bandwidth. Fan-out is handled automatically by the tool, but understand that every destination receiver require a slice of pipe.
This is sometimes called catch up / retrieval time, but nobody ever thinks about that until it’s broken. The calculator looks at your spare capacity (beyond your normal traffic) and calculates how quickly it will empty out the backlog if your sender gets behind. That tells you whether you have a short catchup time; in which case you’ll be able to survive some small hiccup of your network without violating your recovery point objectives or losing any data correctness. Or does it indicate you should increase your retention buffer on the sender side because otherwise too much will get deleted from older logs before they make it to their destination?
Don’t guess if your link is big enough, design for those moments that actualy matter. Know the difference between average flow and burst pressure. Run real samples through your compression ratios. Compare your peak multipliers against past busy hour. Make sure your intervals gives you time for batches to clear out before the next comes in. Don’t let log shipping use whatever leftover capacity is available after your users’ queries are done. Treat it as critical application traffic that deserves its own capacity reservation.