Health Check Interval Calculator
Estimate failure detection time, recovery time, probe traffic, and false-positive risk for load balancers, Kubernetes probes, reverse proxies, and home lab monitors.
Pick a platform baseline, then adjust the endpoint count, thresholds, timeout, target window, and tolerance for your own environment.
HAProxy HTTP Check
Fast active probing. Short intervals work well when timeout is lower than interval and thresholds avoid one-off deploy blips.
NGINX Upstream Probe
Useful for reverse proxy pools. Tune slowly if the upstream app pauses during cache warmups or reloads.
Kubernetes Liveness
Restart-oriented checks should be conservative because false positives can restart a pod that might have recovered.
Kubernetes Readiness
Traffic-drain checks can be faster than liveness because they remove endpoints without restarting the workload.
AWS ALB Target Group
Default-style intervals are intentionally calm. Lower values increase request volume across every registered target.
Cloudflare Origin Check
WAN checks need more slack for routing variance, TLS handshakes, and regional measurement paths.
Keepalived Script Check
Script checks can be very light, but detection should include script runtime and any external command timeout.
Database TCP Probe
TCP probes are cheap, but they do not prove the database can answer real queries or pass authentication.
Home Lab Reverse Proxy
A balanced profile for Caddy, Traefik, and NGINX in small labs where downtime and noise both matter.
| Preset | Interval | Timeout | Thresholds | Best use |
|---|---|---|---|---|
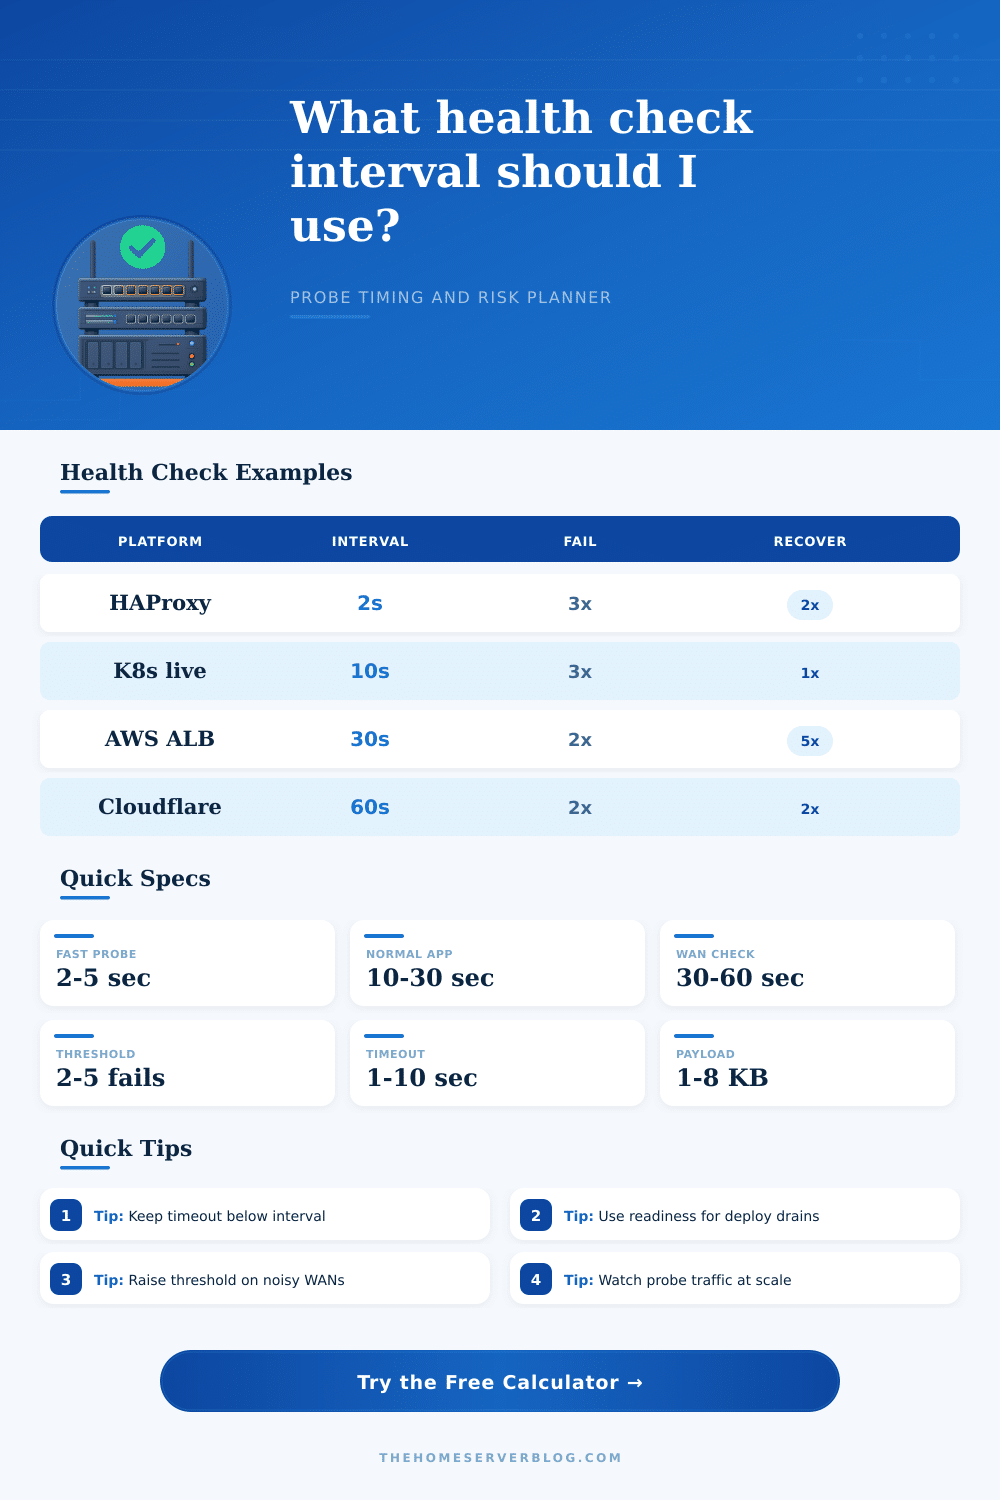
| HAProxy HTTP Check | 2 seconds | 1 second | 3 down, 2 up | Fast LAN service pools with reliable response time. |
| NGINX Upstream Probe | 5 seconds | 2 seconds | 3 down, 2 up | Reverse proxy upstreams and app nodes. |
| Kubernetes Liveness | 10 seconds | 2 seconds | 3 down, 1 up | Restart checks where false restarts are painful. |
| Kubernetes Readiness | 5 seconds | 1 second | 2 down, 2 up | Traffic removal during deploys and warmups. |
| AWS ALB Target Group | 30 seconds | 5 seconds | 2 down, 5 up | Managed public load balancer target groups. |
| Timing formula | Formula | What it means | Tuning lever |
|---|---|---|---|
| Nominal detection | (unhealthy - 1) x interval + timeout + RTT | Time after a failure begins while probes are already scheduled. | Lower interval, timeout, or unhealthy threshold. |
| Worst detection | Nominal detection + interval | Adds the wait if the service fails just after a probe completes. | Lower interval if worst case matters. |
| Nominal recovery | (healthy - 1) x interval + RTT | Time to mark the endpoint healthy after the first good response. | Lower healthy threshold or interval. |
| Worst recovery | Nominal recovery + interval | Adds the wait until the next successful check starts. | Shorter interval or external readiness signal. |
| Traffic driver | Effect | Why it matters | Home lab guidance |
|---|---|---|---|
| Endpoint count | Linear growth | Every endpoint gets its own scheduled probe. | Group checks by service tier when possible. |
| Interval | Inverse growth | Cutting interval from 30s to 10s triples check volume. | Use fast checks only for user-facing paths. |
| Payload KB | Linear growth | Full HTTP health endpoints can return more than a status byte. | Keep health responses small and cache-free. |
| WAN monitor | Extra overhead | TLS, region fan-out, and redirects add bytes and jitter. | Prefer a tiny status endpoint. |
| Platform | Common interval | Common timeout | False-positive control | Watch out for |
|---|---|---|---|---|
| HAProxy | 2 to 5 seconds | 1 to 2 seconds | Rise/fall thresholds | Application reload spikes. |
| Kubernetes | 5 to 10 seconds | 1 to 3 seconds | Separate readiness and liveness | Probe-induced restarts. |
| AWS ALB | 15 to 30 seconds | 5 seconds | Healthy threshold | Slow recovery with high healthy counts. |
| Cloudflare | 30 to 60 seconds | 5 to 10 seconds | Regional checks and threshold | Internet path variance. |
| Keepalived | 1 to 5 seconds | Script-defined | Weight and fall behavior | Slow shell commands. |
At some point in your career, your home lab has deployed into void and stayed dark, filling logs with error messages as you stare at an unchanging screen. The load balancer hasn’t stopped sending traffic that way, because it’s patiently awaiting someone’s permission to stop thinking the system has not failed. Health check intervals and thresholds is how that permission is granted: When does the load balancer mark a server as healthy enough to accept requests? And when does it decide that it’s unhealthy enough to be taken out of rotation? It’s less about being fast then about finding just the right balance between patience and precision.
Once you know number of endpoints to check and when you want them checked (timing preference), you enter it into the calculator at top of page and let it do math for you. No more guesswork about how many failed probes should trip an alert or how long it’ll take servers to recover after restarting. You can keep default setting of “fast.”
How to Balance Speed and Stability in Health Checks
Most people will assume it is fast, and they will also assume that faster means better uptime. But there’s no such thing as “speed without tolerance”. Sure, a two-second interval sounds great…until you realize network jitter or even a momentary garbage collection pause can result in a false positive, removing a perfectly good server from the pool in your reverse proxy. With this tool, you get to visually see the trade-off: enter your desired tolerance and threshold and find out how much risk of false positives you face each day.
Take Kubernetes as another example. In Kubernetes you have two types of probes: liveness checks and readiness checks. While a readiness check controls traffic flow (e.g., do I take this endpoint off the service mesh), a liveness check determine if the pod should be killed and whole app restarted. Setting your liveness probe’s sensitivity too high, or its interval too low, could mean that your app restarts after a brief memory spike when otherwise it would of not have needed to restart. That’s bad feedback. It kills the app.
A readiness check doesn’t kill the app; it just takes it off the service mesh. So it can be more aggressive. The page has a nice table that details where various platforms makes that distinction. Since HAProxy operates in a stable LAN environment with predictable response times, it uses shorter intervals and lower thresholds. On the other end of the spectrum, cloud services like Cloudflare monitor their origins over wide area network, accounting for all of the latency spikage and regional routing variance. They tend to use far longer intervals and higher healthy thresholds to compensate for that.
Another sneaky cost is probe traffic, one you’re likely to only notice as you scale out. Each probe is a TCP handshake or HTTP request, so each endpoint times eight checks per second (or whatever interval time) times 12 endpoints equals a lot of background traffic. That’s not just wasting bandwidth; those are CPU cycles on your back-end servers spending their lives processing monitoring requests rather than user queries. The calculator will show you how much of that load is added so you can understand the true cost of aggressive monitoring.
Maybe for your database cluster you want to check every five seconds. For your static asset server, maybe checking every five seconds are overkill. Your timeouts should be less than your intervals: If you set an interval of 4 seconds but a timeout of 3 seconds, then the system will spend most of its time waiting for things to fail instead of checking to see if they succeeded. That leads to a bottleneck. When something fails, it stacks up probes which slows down how long it takes the system detect the failure. The tool compares your timeout to the round-trip time of the probe. It signals an imbalance if there is not a healthy margin between the two. This margin ensures they can finish cleanly without any open connections.
Perhaps the most valuable output of all is false positive risk. A check taking two milliseconds longer doesn’t mean your house is on fire; no need to page yourself at 2 AM. Home labbers don’t want false positives. They set a tolerance percent here, which tells the calculator to estimate how frequently noise generates an alert. This is one of those tiny things that adds up. When you’re trying to get some sleep, it matters.
We don’t try for zero downtime. We have controlled downtime. Some brief interruptions are expected to gain clarity and stability. See what happens as you dial in the inputs: As you lower the interval, it detects faster, but it also gets more busy (false positives and load). As you raise the unhealthy threshold, it’s quieter, but slower to respond to actual outages. It’s a balance, and there isn’t a right answer. Just an answer that suits you and your tolerance for speed vs. Noise.
Use the calculator to get the numbers and then make that call confidently instead of nervously. This is the bottom line. You don’t just configure servers. You define your system’s learning rate from its own mistakes.