Home lab, edge, reverse proxy, DNS, and API protection
DDoS Mitigation Capacity Calculator
Estimate whether your scrubber, anycast footprint, filtering rules, and origin link can survive a volumetric flood, packet-rate attack, SYN flood, or application-edge overload.
Mitigation breakdown
Rule drop plus extra SYN-specific filtering after the first-pass rule stage.
Legitimate traffic that still consumes scrubber and origin-side capacity.
Buffered demand above the configured mitigation capacity.
Small packets can be harder than raw bandwidth for firewalls and proxies.
Upstream ACL and RTBH
Fast coarse filtering for obvious bad sources, protocols, ports, or emergency blackhole routes.
Scrubbing center
Absorbs volumetric bandwidth, removes known attack patterns, and forwards clean traffic.
Anycast edge
Splits routed load across POPs, but uneven BGP paths can still make one location hot.
SYN proxy or cookies
Stops incomplete handshakes from filling origin connection tables during TCP floods.
WAF and rate limits
Reduces HTTP request floods after L3 and L4 capacity is already under control.
Origin isolation
Private tunnels, allowlists, and hidden origin IPs keep attackers from bypassing the edge.
Healthy margin
PPS warning
Origin target
POP skew guard
| Attack pattern | Main pressure | Calculator input to watch | Mitigation focus |
|---|---|---|---|
| UDP game flood | High bandwidth and high packet rate | Attack Gbps, packets per second, packet bytes | Upstream filtering, protocol allowlists, and scrubbing capacity |
| SYN flood | Half-open connection state | SYN flood share and packets per second | SYN proxy, cookies, stateless drops, and origin connection limits |
| DNS amplification | Very high reflected Gbps | Attack bandwidth and scrubber capacity | Anycast DNS, response rate limiting, and provider scrubbing |
| HTTP request flood | Application worker and cache pressure | Rule drop rate, legitimate Mbps, origin link | WAF rules, cache shielding, bot checks, and rate limits |
| Average packet size | What it implies | PPS risk | Planning note |
|---|---|---|---|
| 60 to 100 bytes | Small packet flood or handshake-heavy TCP attack | Very high device CPU pressure | Track Mpps limits, not just Gbps capacity |
| 250 to 600 bytes | Mixed UDP, TCP, or bot traffic with moderate payloads | Medium to high | Compare packet-derived Gbps with provider telemetry |
| 800 to 1200 bytes | Amplification or larger UDP responses | Medium | Bandwidth capacity is usually the first limiting factor |
| 1400 bytes and up | Near-MTU payload flood | Lower packet count per Gbps | Still watch tunnels, fragmentation, and interface saturation |
| Capacity margin | Interpretation | Action | Metric to monitor |
|---|---|---|---|
| Above 30% | Comfortable mitigation headroom | Validate rules and keep origin locked down | Clean traffic Mbps and POP spread |
| 10% to 30% | Usable but tight during bursts | Raise buffer, add POPs, or pre-stage provider escalation | Scrubber utilization and BGP path skew |
| 0% to 10% | Little room for telemetry error | Reduce attack surface and raise clean-pipe capacity | Drop counters and tunnel saturation |
| Below 0% | Modeled demand exceeds capacity | Increase mitigation capacity or shed traffic upstream | Provider discard rate and origin leakage |
| Origin exposure | Good range | Risk signal | Practical control |
|---|---|---|---|
| Reverse proxy origin | Below 50% link use | Direct origin IP discovered | Firewall allowlist only the proxy or tunnel endpoints |
| API service | Below 60% link use | SYN or TLS handshakes reaching app nodes | SYN proxy, TLS edge termination, and request rate limits |
| Game server | Below 70% link use | UDP query floods passing filters | Protocol validation and dedicated game DDoS profiles |
| DNS service | Below 65% link use | Amplified responses or open recursion | Anycast authoritative DNS and response rate limiting |
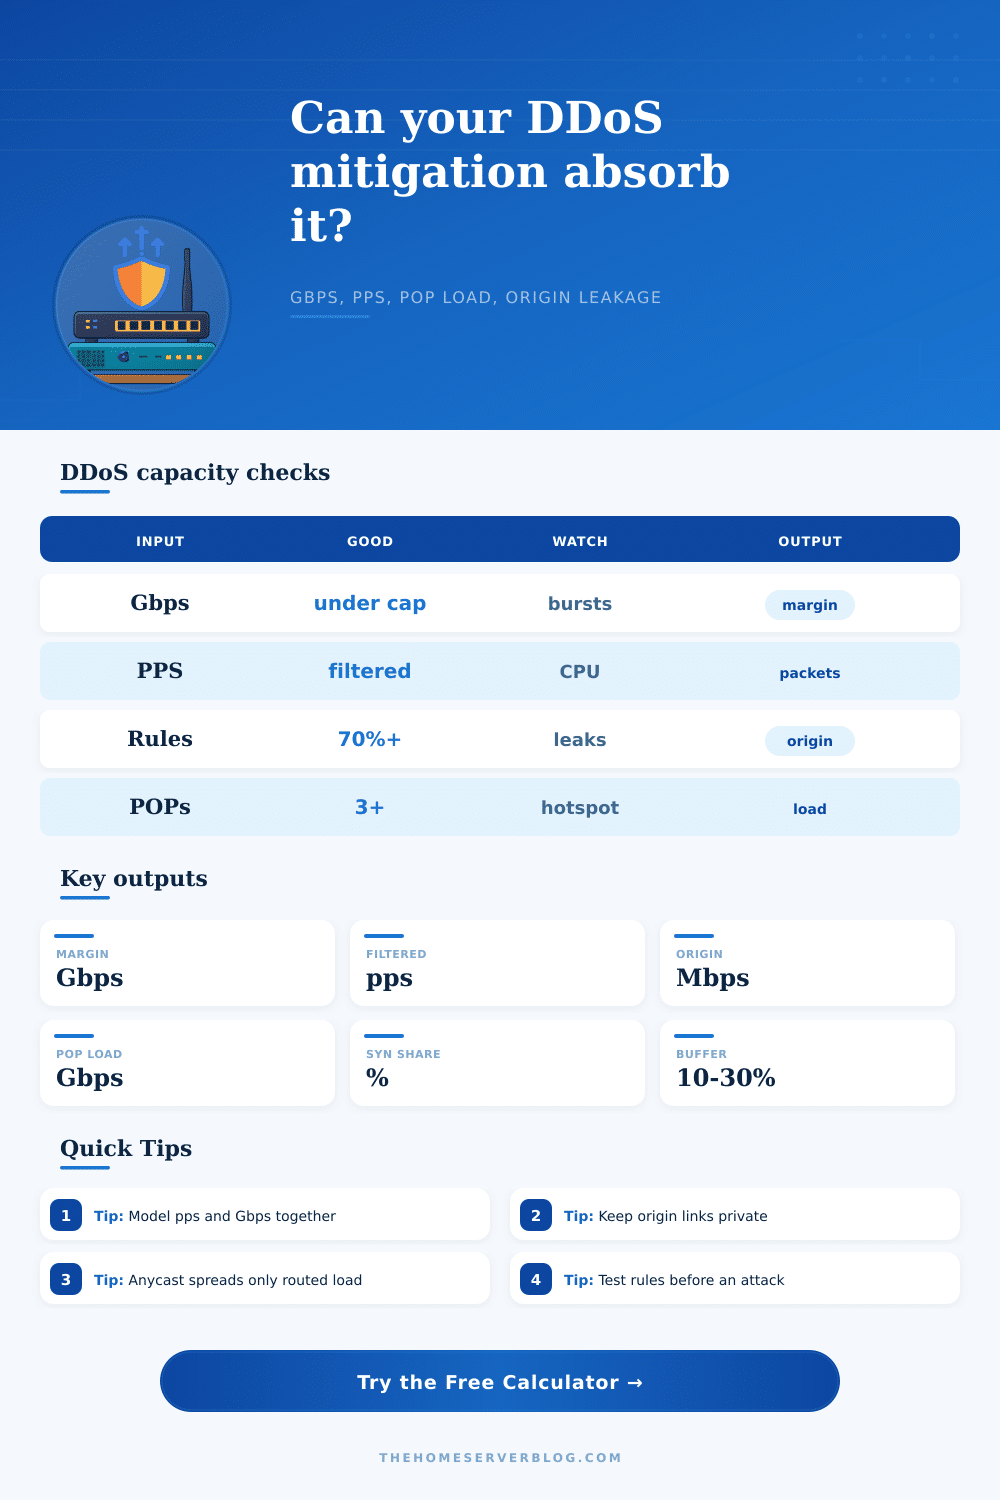
Volume isn’t usually point with a DDoS attack. It’s always about pressure from a specific direction, targeted at the weakest link of whatever you’re trying to defend. When most teams considers bandwidth capacity, it’s in gigabits per second, which is what ISP bills represent. What they neglect to remember are packets per second, because their firewall CPU hits one hundred percent before pipe has any room left. The difference between raw throughput and stateful processing power is the gap where most mitigation strategies fail before they even start.
I’ll let the calculator do the math above, but knowing what goes into it help you defend your network different than usual. It is obvious what bandwidth means. Sure, a forty gigabit scrubber seems like enough space. But then you remember that a tsunami of small packets can blow through connection tracking table before exhausting available bandwidth. So modeling both packets per second AND gigabits is not optional if you’re doing this for real.
How to Protect Your Network from DDoS Attacks
Is your attack a swarm of bees in a ventilation shaft? Or is it more like a heavy truck barreling down a narrow bridge? That completely changes how you want to defend against it. The other essential input is the rule drop rate, which is how much bad traffic your filters actualy catch. The common mistake people make here is assuming that their web application firewalls and access control lists blocks what they’re supposed to be blocking. In general, they don’t.
Seventy percent seems like a reasonable expectation for how effective your rules are going to be. That means the remaining thirty percent leaks through, either by being a new kind of way to attack or by having overly-broad rules that end up tripping on legit users. When you size your origin link, you need to account for the leakage. Designing with the assumption of perfect filtering will leave you with a system that can’t take the imperfections of reality.
You should of pay particular attention to SYN floods. Unlike other flooding types, these specifically target handshake state instead of just filling pipes. By starting up connections that never actually terminate, these attacks gobble up both CPU cycles and memory. To measure the extent of this pressure on your cookie or proxy services, the calculator take into account a custom SYN share percentage.
In short: if half (or more) of your traffic consists of half-open handshakes, upstream bandwidth scrubbing won’t protect you, you’ll need some sort of proxy mechanism or stateless termination to eat up the handshake burden before it hits your origin servers. The other factor that’s even more important but much less spoken about is geography. Capacity is spread out with anycast routing among several points of presence, which prevents any single data center from becoming a bottleneck. But it’s rare for all BGP paths to be exactly equal.
Route preference and regional peering agreements can cause some locations to attract more traffic. The tool shows you how much each POP is carrying, letting you know whether you might have a hotspot issue. If you constantly find yourself having to throw more resources at one node, then your global capacity number isn’t accurate. You’re only as good as your weakest link.
The most fundamental rule of DDoS protection is keeping your origin IP secret. What good are all those scrubs if the attacker has a straight shot to your servers? Implement strict allowlists and use private tunnels so only your mitigation vendors can access your servers. If you accidently leak your real IP address via historic DNS entries or other misconfiguration, congratulations! You’ve erected a castle with an open back door.
In the end, it’s less about what spec sheets say and more about how much breathing room you have. How long will that take to respond after you see something? What if someone suddenly starts sending a lot? Twenty percent (or more) buffer capacity lets you change rules on the fly without impacting good traffic. This level of fine-grained modeling allows you to act ahead of time rather than reacting in a panic. Not only can you weather the storm, but also stay online when others are offline.