HomeServerBlog edge capacity tool
Edge Compute Capacity Calculator
Estimate daily compute milliseconds, GB-seconds, per-POP concurrency, origin offload, subrequest pressure, payload transfer, and utilization headroom for edge middleware, workers, routing, and cache logic.
Daily volume converted into steady requests per second before burst concentration.
Peak request pressure after buffer and uneven edge traffic concentration.
Cache misses that still need a fetch, API call, or backend handoff.
Quick read on CPU time, memory weighting, concurrency, and subrequest pressure.
Middleware path
1-10 ms CPUBest for auth gates, redirects, header changes, cache key edits, and early request decisions.
Worker function
10-50 ms CPUFits token checks, small HTML edits, bot rules, API fanout, and regional routing logic.
Image edge path
High memoryResize and transform flows can be memory-weighted even when cache hits hide most requests.
IoT gateway
High volumeDevice fan-in usually stresses request rate, subrequests, and burst handling before payload size.
| Preset | Typical CPU shape | Cache behavior | Primary capacity signal |
|---|---|---|---|
| Auth Edge Middleware | JWT parse, cookie check, route match | Often runs before cache lookup | Compute milliseconds and peak concurrency |
| Image Resize Edge | Transform CPU and memory-heavy variants | High cache hit after warm variants | GB-seconds and cold start allowance |
| A/B Test Router | Cookie bucketing and header rewrite | Usually high hit rate | POP concurrency and origin offload |
| Geo Redirect Worker | Location lookup and redirect decision | High hit rate after rules settle | Request rate spread across POPs |
| IoT Edge Gateway | Validation, enrichment, queue handoff | Low cache hit by design | Subrequests and sustained peak rate |
| Input | What it changes | Healthy direction | Watch when |
|---|---|---|---|
| Requests per day | Base invocation volume and response payload | Spread across more cacheable routes | Peak traffic is much higher than daily average |
| CPU ms/request | Daily compute milliseconds | Keep parsing and rules short | Heavy crypto, transforms, or large HTML parsing appear |
| Memory MB | GB-seconds and isolate density | Use the smallest safe runtime memory | Transforms or large buffers raise memory needs |
| Cold start percent | Extra startup CPU and duration | Keep bundles small and avoid heavy initialization | Deploys, rare routes, or many POPs raise cold paths |
| Safety buffer percent | Peak concurrency and utilization | Higher for uneven global traffic | Traffic concentrates in a few regions or retry waves |
| Cache hit band | Origin request share | Edge behavior | Planning note |
|---|---|---|---|
| 95-99% | Very low miss traffic | Edge mostly serves cached decisions or assets | Watch invalidations and variant explosion |
| 80-95% | Moderate backend relief | Good for middleware, routing, and static transforms | Track paths that bypass cache rules |
| 50-80% | Origin still sees many requests | Mixed dynamic and cacheable edge paths | Use route-level hit rate, not only site average |
| 0-50% | Origin remains a main dependency | API checks, telemetry, auth, or personalized content | Subrequest limits and backend pools matter more |
| Runtime pressure | Early sign | Calculator output | Adjustment to test |
|---|---|---|---|
| CPU-heavy logic | Tail latency rises on dynamic routes | Compute ms/day | Precompute rules or move parsing out of hot path |
| Memory-heavy work | Transforms need larger isolates | GB-seconds | Cache variants and avoid whole-response buffering |
| POP concentration | A few regions saturate first | POP concurrency | Raise buffer or split traffic by route |
| Origin dependency | Backend fetches dominate misses | Origin offload | Increase cache hits or collapse duplicate subrequests |
| Subrequest fanout | KV, API, and fetch calls stack up | Subrequests per day | Batch reads and cache authorization metadata |
This lasts until you check your bill at the end of the month. Serverless sounds cheap. Sure, I’ll spin up a worker for image resizing or authentication. It’s just a couple lines of code and I can do that knowing I’m only paying for what I use.
Well, not so fast. You’re actualy charged for how long your code runs, how much memory it reserve, how often it misses the cache, and other factors. Get any one of these variables wrong, and that negligible line item become a nasty surprise at the end of the month.
How to Calculate Serverless Costs
To do so, you feed the above calculator your request runtime specs (CPU milliseconds per call, etc) and request volume (daily request count, etc). That way, you don’t have to worry about conversions or coefficients, the calculator do all that work for you.
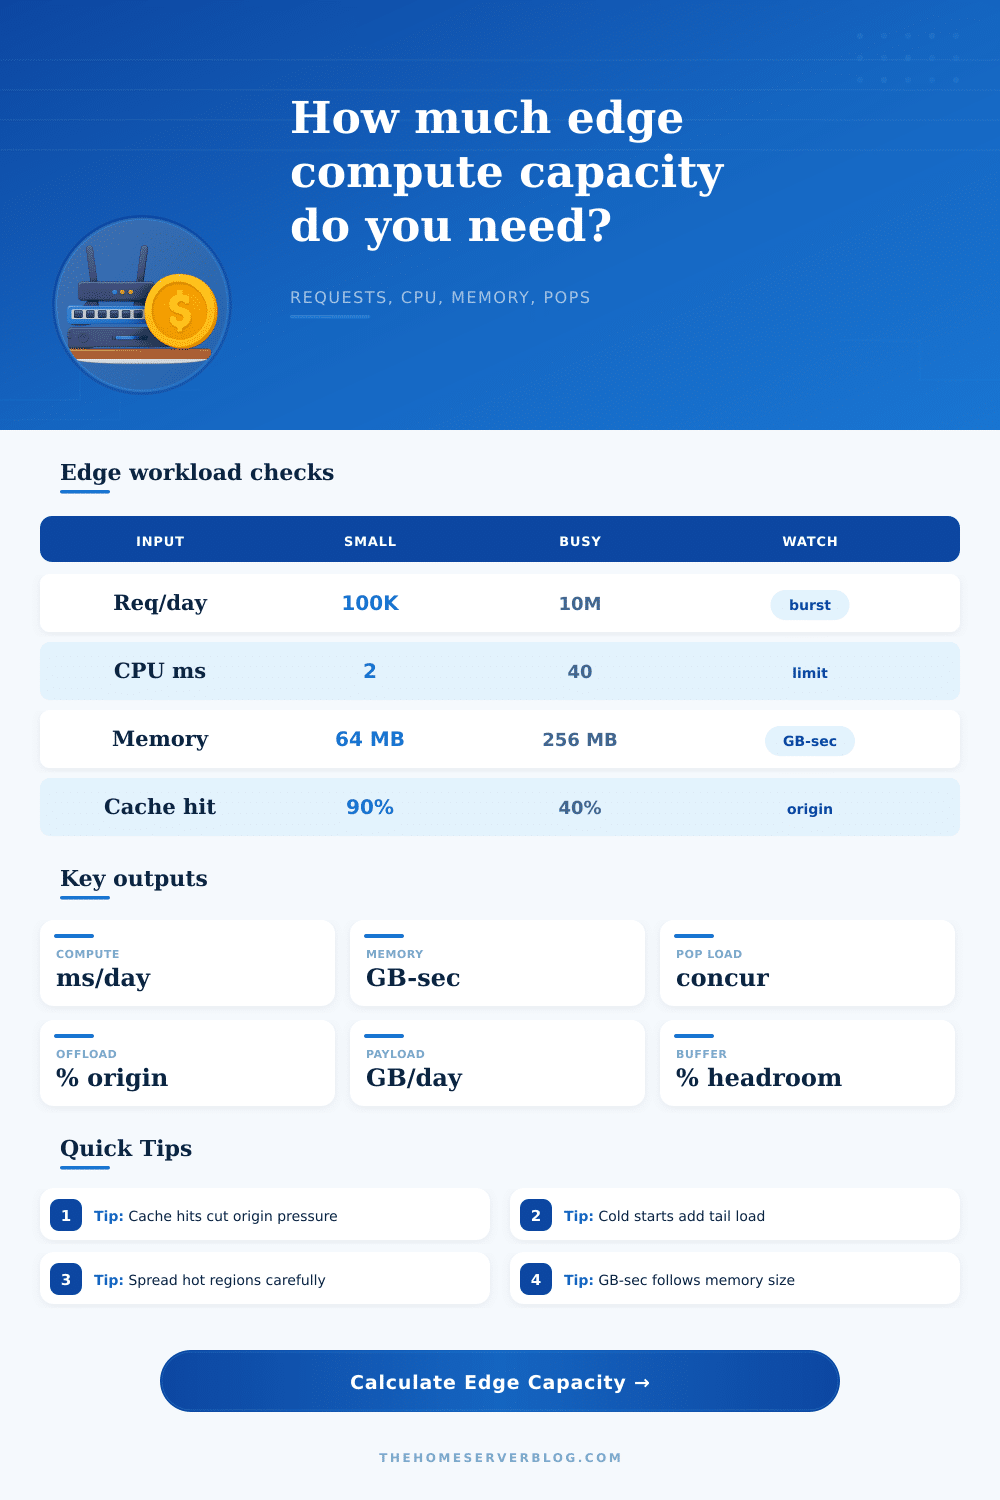
First, you enter what seems like straightforward stuff: How many requests per day? How long does each one take? But then there’s usually the gotcha: how much memory are you using? Developers tend to just use whatever their app require to run. They aren’t thinking about how much they’re spending to reserve that amount of memory while it sits there idle. Turns out if you only need forty milliseconds, but your function has reserved two hundred fifty-six megabytes of RAM, you’re paying big bucks for unused capacity. The tool converts this time and space into something known as GB-seconds, which is what most edge providers actually bill by. A little thing, but it matter significantly for high-volume endpoints.
The other factor that dominates your costs is the cache hit rate. A ninety percent hit rate means only one in ten requests hits your origin server or triggers subrequests. Knock that down by half to 50%, and not only does your compute load double, but it also multiplies since every missing request typically entails making an API call, reading data from somewhere, or writing something into a key-value store. Is most of the work done at the edge? Or are you just being a traffic cop? The page has a reference table that makes this clear. It shows how lower cache rates push more load toward backend dependencies, network calls, or pure CPU time.
A second underappreciated element is concurrency limits: “Sure, my average request rate per day is small, but hey, at least I’m not overloading things, except when everyone hits me at once during a product launch, then I bump up against the limit.” To model that bursty behavior, the calculator will ask how much safety buffer to add. If you don’t do that, your peak use looks great on paper yet your users see error messages and time-outs instead, because your actual experience has become lousy. This happened not because amount was big, but because its shape (over time) were bad.
There’s yet more overhead around cold starts: the more regions that invoke your edges and the less frequently your edge functions run, the greater the cost for spinning up a fresh isolate each time. To account for this additional compute drag, the tool assume a cold start percentage. Reducing this penalty means avoiding excessive initialization code and keeping bundle size small. It’s usually more easiler fixed than raising your concurrency limit.
Various types of workloads are broken out in the reference data that ships with the tool. These workloads are high frequency but generally CPU light (e.g., auth middleware). Some workloads is memory heavy regardless of whether there are cache hits (e.g., image resizing, you have to hold the buffer around to transform it). Another type is stressing subrequest limits (e.g., IoT gateways, where each ping from one of these devices could cause a validation check). Understanding what bucket your app fits into will help guide you as to how to set the inputs properly. Origin offload + POP concurrency may be your main constraint if you’re running an A/B test router rather than sheer number of CPU cycles.
Edge capacity planning is not merely form-filling. It involves thinking through how traffic will respond to unexpected volume, like a marketing campaign) or when something goes wrong. Review your actual latency percentiles and error logs against the outputs from the calculator. Where do your bottlenecks occur? What’s saturating. CPU, or network fanout? Often adjusting your cache strategy will do far more good for performance than tweaking a couple lines of Javascript.
Begin with your existing traffic. Assume that it’s distributed evenly across the globe (a conservative assumption). Apply the safety buffer. Calculate your bill for this traffic using these assumptions. Compare this bill to what you paid last month. Is it the same? Congratulations, you’ve got a working model. It isn’t? Revisit your assumptions about cold start frequency and memory reservations.
Stop guessing how much infrastructure you need to spend. Instead, engineer spending based on real-world runtime behavior different than theoretical limits. Respect the math behind the milliseconds, edge compute scales beautifully.