HomeServerBlog edge, origin, VPN, and ingest planner
Ingress Bandwidth Calculator
Size inbound bandwidth for reverse proxies, IP cameras, offsite backups, VPN users, CDN origin pulls, log collectors, and short burst traffic before your WAN or origin link becomes the bottleneck.
Ingress breakdown
Headroom signal
Good for home reverse proxies, light VPN, small origin pulls, and modest backup windows after TCP/IP overhead.
Useful when cameras, logs, or media syncs share the same ingress path and 1G runs too hot.
Practical for lab aggregation, CDN origin, multiple VLAN ingest, and high-speed replication targets.
Often limited by tunnel service, single-thread throughput, CPU, and distance to the tunnel POP.
Can absorb public ingress and forward only clean traffic, but the private origin link still needs sizing.
Reduces repeat origin hits, but cache misses, purges, webhooks, and large downloads can still burst.
| Preset | Typical source | Peak pattern | Sizing concern |
|---|---|---|---|
| Home reverse proxy | Web users, apps | Spiky | TLS, cache misses, uploads |
| Camera NVR | IP cameras | Steady | Constant bitrate and motion clips |
| Offsite backup | Replication client | Windowed | Finishing before the backup window closes |
| VPN users | WireGuard or OpenVPN | Bursty | Shared uplink, MTU, encryption CPU |
| CDN origin | Edge cache misses | Flash bursts | Origin shielding and private link ceiling |
| Traffic type | Per-source range | Burst factor | Planning note |
|---|---|---|---|
| 1080p camera | 4-8 Mbps | 1.2-1.6x | Use stream bitrate plus events |
| 4K camera | 12-25 Mbps | 1.2-1.8x | Watch VBR spikes |
| Reverse proxy | 5-100 Mbps | 3-8x | Uploads and uncached pages spike |
| VPN user | 5-50 Mbps | 2-5x | Interactive traffic dislikes saturation |
| Log sender | 1-10 Mbps | 2-4x | Batch flushes create peaks |
| Ingress path | Practical ceiling | Best use | Constraint |
|---|---|---|---|
| 100M WAN | 90 Mbps | Small proxy, light VPN | Low burst room |
| 1G WAN | 940 Mbps | Home lab edge, NVR | Router and ISP shaping |
| 2.5G WAN | 2350 Mbps | Mixed ingest, media sync | Switch and firewall ports |
| 10G edge | 9400 Mbps | Origin, replication, lab core | CPU, storage, optics |
| Cloud tunnel | 50-500 Mbps | Private apps, admin panels | POP distance and tunnel limits |
| Rule of thumb | Value | Use when | Why it matters |
|---|---|---|---|
| Healthy edge load | <70% | Always-on services | Prevents latency and drops |
| Upgrade trigger | >90% | Any production origin | Little room for retransmits |
| Daily transfer | Mbps x 10.8 | Sustained average | Approx GB per day |
| Monthly transfer | GB/day x 30 | Capacity planning | Shows ingest trend pressure |
| Buffer | 15-30% | Internet-facing apps | Covers burst and overhead error |
Your media server is streaming sweetly until you try to upload something. Then the internet goes wonky. Why? This usually happens because your inbound bandwidth is full, not because any hardware have failed. People obsess over download speeds but dont consider how much traffic comes in; leaving their network open to bottleneck at prime times.
Inbound traffic behaves more diffrent than outbound browsing habits. Instead of smoothly flowing, inbound traffic arrive as sharp spikes. They burst into the pipe and can clog it for minutes, that creates timeouts on all other service using that same pipe.
Why Your Upload Speeds Are Slow
This incoming bandwidth calculator predict capacity for backups, log uploads, CDNs, camera uploads, VPNs, proxies, and bursts, and sizes your links for real traffic. Averages dont tell the whole story. That four-megabit-per-second security cam averages four, but during an event where something’s moving, it’ll send 10 times as many bits per second. And if there is big change in lighting, it’ll encode that too. If you plan for only average, you are going to start dropping packets right when you need your bandwidth most.
Plan for the burst multiplier. For some traffic, like a reverse proxy doing large uploads, the multiplier should of way up high. For steady state traffic, like a log collector, it should be lower. Whatever your scenario, enter it into the tool, adjust the coefficient, and let the calculator do the math for you. Dont guess at how spikes combine when several source go off at once. Try to predict worst case; hope for the best isnt going to cut it.
Your ISP’s limits and hardware can handle various kinds of traffic differently. Some kinds of traffic like camera feeds (assuming constant bitrate encoding) are fairly predictable, but they’re on 24/7. This means that you will have some capacity usage all the time eating it up steadily and quietly. Other things like backup syncs or media syncs tend to happen at certain times. They take terabytes of data and try to shove them through in an hour, putting maximum pressure on your uplink for that particular time period. You dont want your backups to collide with your cameras.
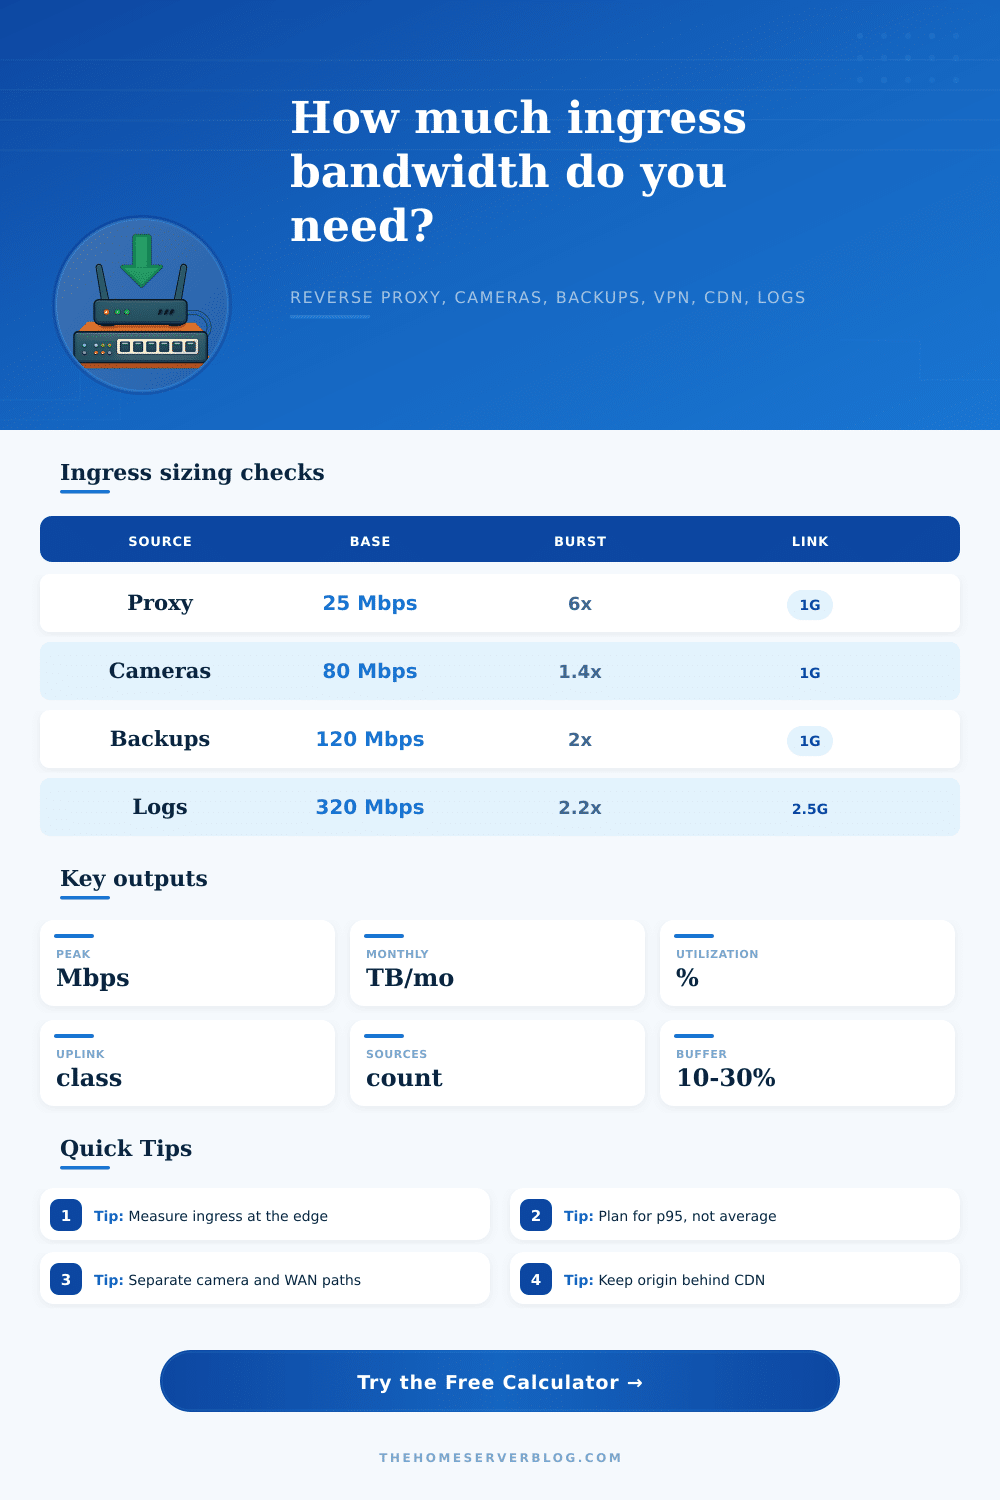
Often you are better off spending money separating those paths into their own VLAN or even separate ISP lines then going up a higher tier. The chart on the page shows how different steady vs. Windowed bursts affects this. These details is laid out in the reference table.
Another wrinkle comes from VPN traffic, which further encrypts the user’s data with an additional overhead layer. That means if you have five simultaneous users, they are not simply contributing their own share on top of everyone else. They are also contributing a bunch of tunnel encapsulation headers and TCP retransmission noise that blow out the payload. The first thing you notice with this type of congestion is that interactive apps such as video calls or games suffers. A lightly congested VPN link will introduce latency, making things seem slow.
This kind of hidden overhead demands a buffer zone. For internet facing services, a buffer of fifteen to thirty percent is considered good engineering practice. That allows for the skew in routing as well as variance in packet size between your router and provider network.
Speed isnt everything; it’s also about monthly transfers. Some ISP plans and cloud services charge based off peak usage or total volume over thirty days. While your pipe may be able to push two gigabits at once, if you’re replicating some large dataset every day then you could still exceed your monthly limit. To help, the tool estimates your monthly transfer in terabytes and lets you compare against what your plan allows. It takes your daily amount of background ingesting and presents a cumulative total that will appear on your bill. That way you wont wake up one day to an overage charge because you ran too many replication job during the week.
Now let’s check how much we’re using those links and compare them with our hardware. After considering management traffic and other TCP IP overhead, we realize that a single gigabit firewall port actualy has a practical cap around nine hundred megabits. Assuming your load calculation was higher than ninety percent of this theoretical maximum, you’re already at risk. Bumping up to ten gigabit or even two point five gigabit ports gives you some breathing room; assuming your storage backend and your ISP can sustain the load. Ideally, you want a constant workload running at less than three quarters utilization (seventy percent). That way you have wiggle room for surprises such as an impromptu surge of remote workers or a cache purge storm. When the network gets busy, sizing ingress will ensure your lab stays steady and your coffee remains undisturbed.