HomeServerBlog service mesh sizing tool
Service Mesh Overhead Calculator
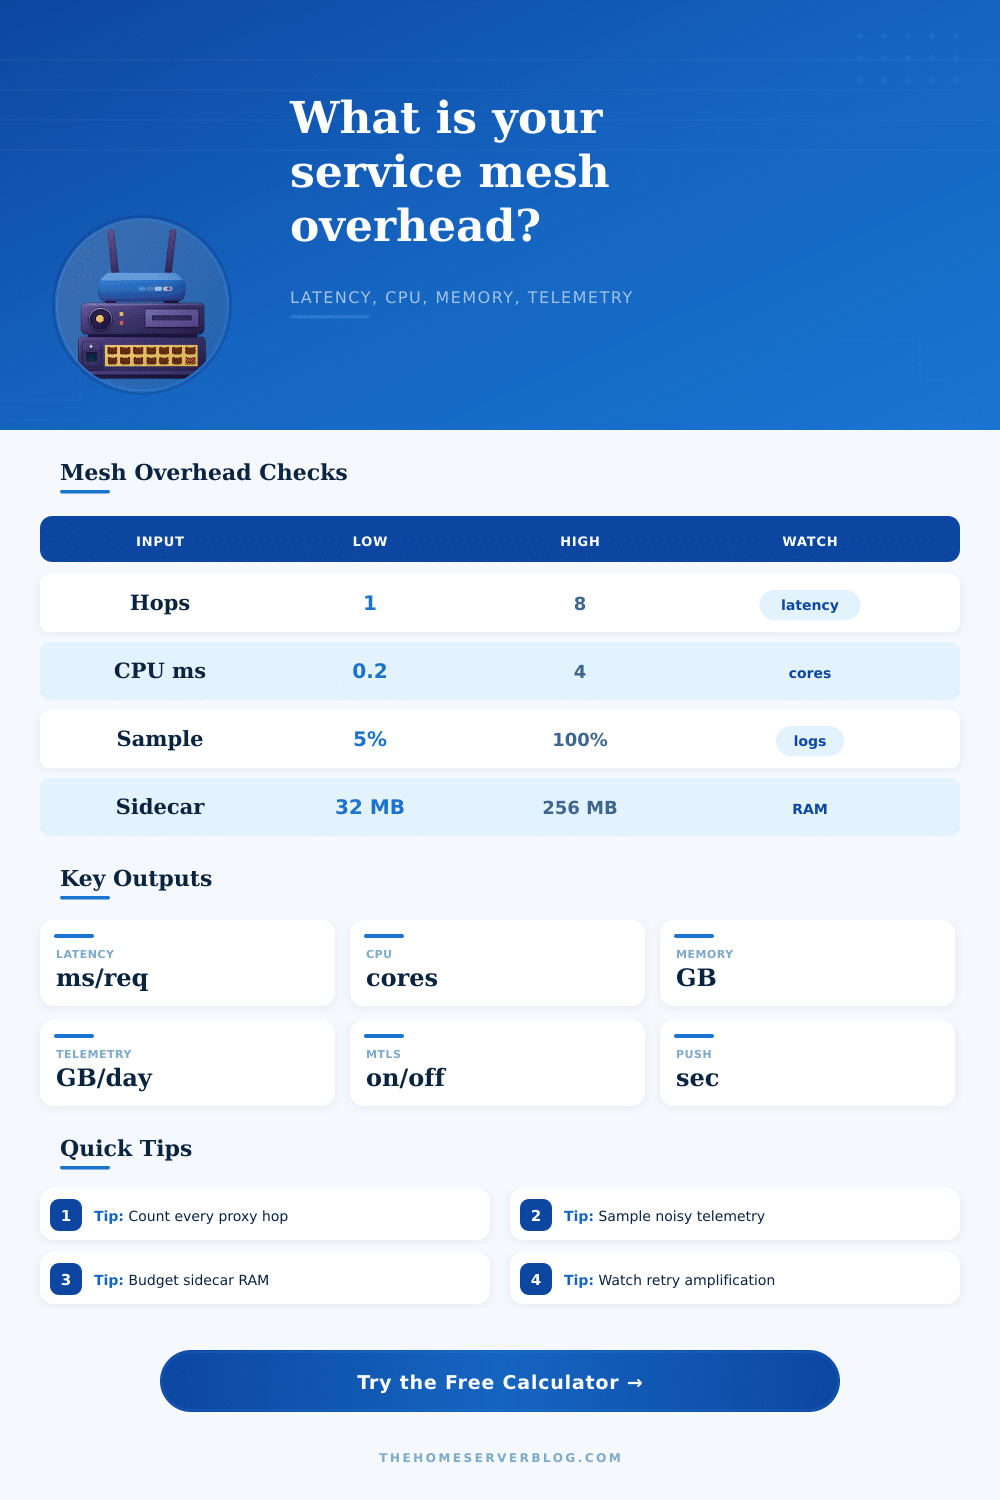
Estimate proxy latency, sidecar CPU, mesh memory, telemetry volume, retry amplification, and control-plane churn before adding Istio, Linkerd, Consul Connect, or another mesh to a home lab cluster.
The calculator models sidecar traversal overhead only. It does not replace measured p95 latency, node pressure, or mesh vendor sizing guidance.
Each service hop usually crosses outbound and inbound proxy paths.
Retries multiply latency, CPU, telemetry, and downstream pressure.
Frequent endpoint changes cause control-plane and proxy churn.
Payload is not copied for every metric, but it shapes proxy work.
Istio / Envoy
Full policy depthGreat traffic shaping and observability. Budget more RAM and control-plane push load in small clusters.
Linkerd
Light sidecarsOften lower memory and simpler operations. Works well when latency and homelab node size matter most.
Consul Connect
Service discovery fitUseful where Consul already owns identity and discovery. Watch proxy choice and catalog update rate.
Ambient / eBPF
Fewer sidecarsCan reduce per-pod memory, but waypoint placement and feature parity change the real overhead model.
| Input | Normal range | High range | Planning note |
|---|---|---|---|
| Services | 5 to 40 | 100+ | Memory scales directly with sidecar count. |
| Requests/sec | 50 to 2,000 | 10,000+ | CPU is usually driven by proxy passes per second. |
| Hops/request | 1 to 4 | 8+ | Each hop adds latency and telemetry events. |
| Retries | 0% to 5% | 20%+ | Retry storms make the mesh look larger than user traffic. |
| Platform | CPU factor | Telemetry bytes | Base hop ms |
|---|---|---|---|
| Istio / Envoy | 1.20x | 950 | 0.42 |
| Linkerd | 0.82x | 650 | 0.25 |
| Consul Connect | 1.05x | 780 | 0.34 |
| Ambient / waypoint | 0.72x | 720 | 0.30 |
| Output | Formula driver | Healthy cue | Watch cue |
|---|---|---|---|
| Added latency | Hops, mTLS, retries | Under 10 ms | Over 30 ms |
| CPU cores | Proxy passes/sec | Under 20% node CPU | Sidecars starve apps |
| Memory | Services x sidecar MB | Fits node reserve | Pods evicted |
| Telemetry | Sample x hops x RPS | Sampled spans | Storage grows daily |
| Scenario | Typical services | Hops | Main concern |
|---|---|---|---|
| Homelab API | 8 to 20 | 2 to 4 | CPU and mTLS latency |
| Batch workers | 15 to 60 | 1 to 2 | Memory footprint |
| Gateway mesh | 10 to 35 | 2 to 3 | Ingress fanout |
| Deep microservices | 40+ | 5+ | Tail latency and traces |
Build a service mesh to get traffic control, observability, and security out of the box, without rewriting app code. Sounds like free lunch, right? Look at your node CPU usage in three weeks. Those little sidecar proxies uses up resources and slow down every single request that crosses from one service to another. Before you realize it, those little costs compound into visible performance issues in your small cluster or home lab.
Use the calculator above to turn vague mesh ideas into real resource budgets, so you can see bottlenecks before they happen. Most people underestimate proxy pass counts; they think in terms of user requests per second but meshes cares about proxy passes, i.e., the number of times a request bounces between microservices inside the mesh. An API call could bounce around five microservice. That’s ten inbound and outbound proxy passes to serve a single interaction. Each traversal take a few milliseconds of CPU time. Six hundred requests per second times ten traversals creates a huge proxy workload that outweighs actual application logic. The tool handles this by letting you define how many hops occur per request. This number is typically higher than what you might expect.
Why Service Mesh Uses Extra Resources
Intuition also breaks down with regards to memory in a small cluster. A certain amount of RAM are required for each sidecar just to handle its own TLS sessions, routing tables, and telemetry buffers. Depending on how complicated your service configurations are, Istio‘s Envoy proxies can gets quite large compared to Linkerd‘s habit of being slim. Running twenty services at once means that these per-sidecar memory requirements will compound quickly. Your nodes may run out of resources because the infrastructure overhead use up all the available capacity before your applications even fail. Being able to know the total memory required by all your sidecars allow you to properly size your nodes from day one.
Intuition also breaks down when it comes to telemetry volume. Distributed tracing is awesome for debugging; you turn it on to locate slow endpoints. However, running at 100% sample rate in prod will produce terabytes of data every day in high-volume systems. That’s why the calculator estimates the volume (based off hop count and sample rate) to help you plan. Sampling rates as high as one-hundred percent are fine when responding to an incident, but they’re not sustainable over time. Typically dropping the sample rate by ten times to five or ten percent will provide enough signal to spot trends, while maintaining storage cost. It is a tradeoff between sustainability and detail.
Retry policies can hides extra load. Clients will by default auto-retry when a service times out, which doubles or triples actual load on downstream services during transient failure. We modeled this in the calculator (it has an input field for the retry percentage). High retrys cause higher latency for successful requests… They compete for CPU along with failed ones. And they generate additional telemetry noise that may obscure root cause. Knowing how many retries you have inflates your effective request rate, which help avoid surprise capacity crunches.
It’s not just about platform choice. Ambient meshes reduce that pod memory usage by removing proxies from individual pods. However, that shifts the load to the dedicated gateway nodes. That could of been controlled in detail with traditional sidecars, which do need reserved resources carefully. Base latencies and CPU factors differ between implementations, and so do their feature sets, which is laid out on the page in a handy reference table. Today, you may save resources with a lighter mesh, but a richer feature set could prevent architectural debt tomorrow.
How often should your control plane push deployments? The more frequently, the more churning proxies you have reloading their certs & routes. Slower deployments are less noisy, but they increases propagation latency. Slower = calmer; faster = noisier. There is a trade-off between update speed and system calmness. It is a little thing, but it is important to cluster stability.
Bottom line: Service mesh overhead isn’t about pure numbers, it’s about knowing which parts of your particular setup consume what resource. The calculator’s a framework; you add the context. Establish your own baseline first, then compare it to the mesh expectations. When CPU reaches ninety percent or latency spikes, you’ll already know who to point the finger at. It’s not about zero overhead, it’s about managing overhead with your eyes wide open. You deploy the mesh to be resilient. Plan to pay the price of being resilient ahead of time.