Peak-to-Average Load Ratio Calculator
Estimate burstiness and crest-factor headroom for home lab CPU, storage I/O, bandwidth, and power draw before you size links, UPS capacity, cooling, or maintenance windows.
⚙Real Home Lab Presets
📊Load Inputs
Burstiness Result
Planning Breakdown
🔧Equipment / Spec Comparison Grid
📘Peak-to-Average Reference Tables
| Subsystem | Calm Ratio | Busy Ratio | Planning Note |
|---|---|---|---|
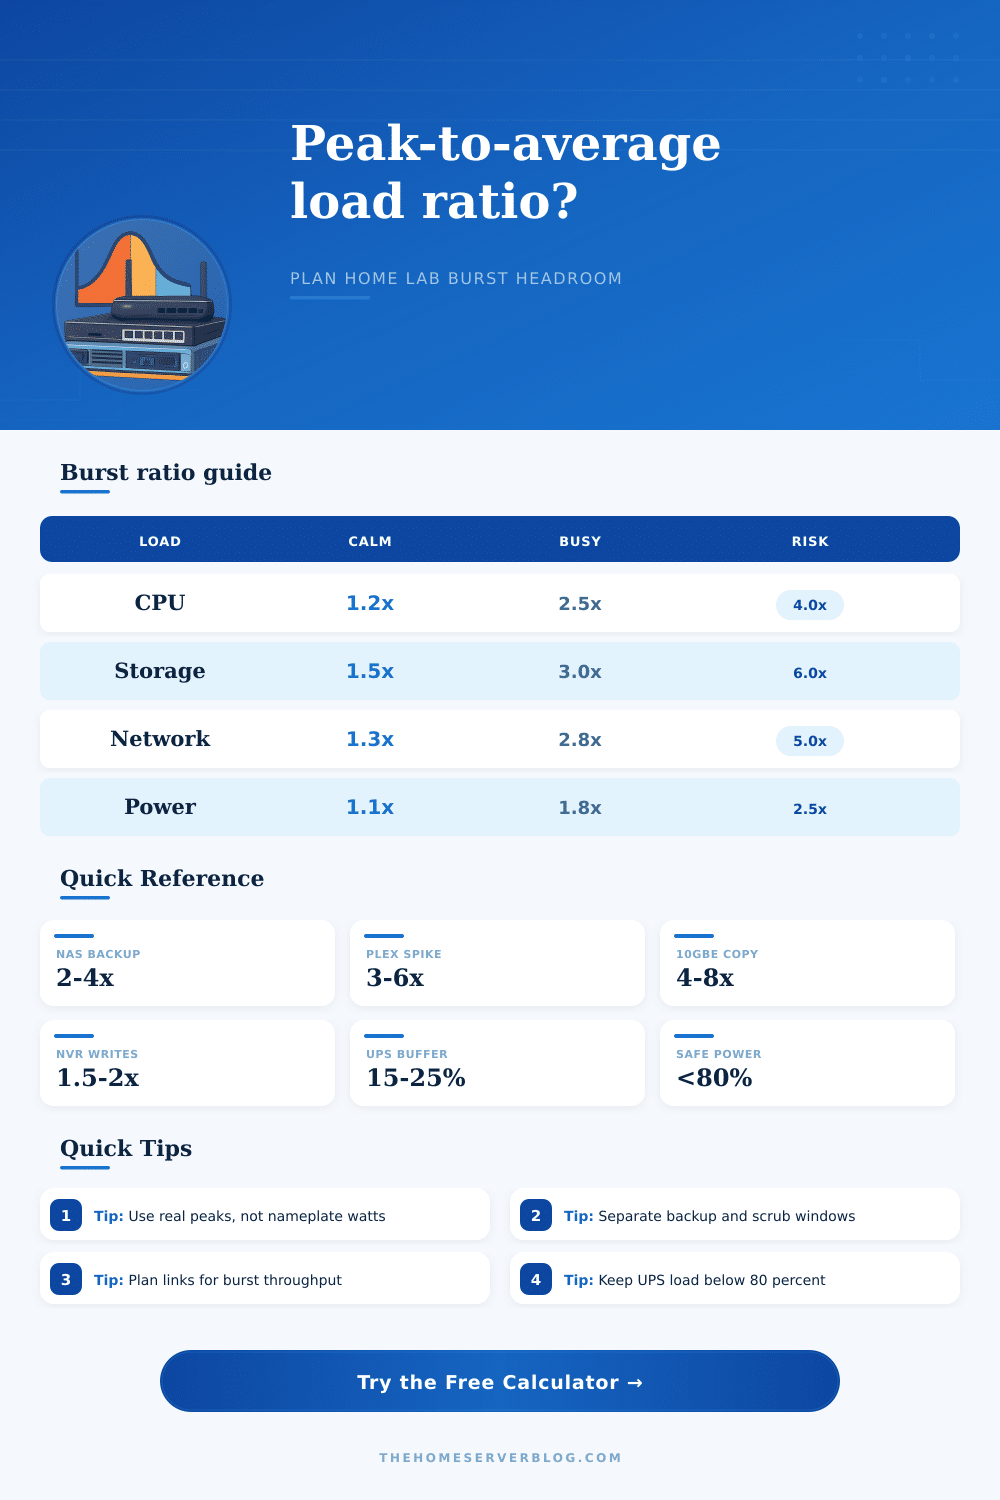
| CPU virtualization host | 1.2× to 2.0× | 2.5× to 5.0× | Builds, scans, and transcodes create short high-load plateaus. |
| Storage array or NAS | 1.5× to 2.5× | 3.0× to 8.0× | Scrubs, rebuilds, and backup windows can stack I/O queues. |
| LAN or WAN bandwidth | 1.3× to 2.0× | 3.0× to 10.0× | Speed tests and sync jobs often saturate links briefly. |
| Power draw | 1.1× to 1.4× | 1.6× to 2.5× | Spin-up, PoE negotiation, and CPU boost lift AC draw. |
| Profile | Useful Limit | Power Ceiling | Best Fit |
|---|---|---|---|
| Mini NAS, 1GbE | 940 Mbps / 220 MB/s | 120 W | File shares, light Docker, nightly backup jobs. |
| Mini PC cluster, 2.5GbE | 2350 Mbps / 650 MB/s | 240 W | Proxmox nodes, lab Kubernetes, CI runners. |
| Rack NAS, 10GbE | 9400 Mbps / 1200 MB/s | 420 W | ZFS pools, media storage, backup targets. |
| Virtualization host, 10GbE | 9400 Mbps / 1800 MB/s | 650 W | VM density, test environments, build bursts. |
| PoE NVR closet, 1GbE | 940 Mbps / 300 MB/s | 380 W | Cameras, NVR recording, access points. |
| 600W UPS group | 1GbE to 10GbE mixed | 480 W target | Router, switch, NAS, one compact host. |
| Common Project | Typical Average | Likely Peak | Ratio to Plan |
|---|---|---|---|
| Nightly NAS backup over 1GbE | 80 to 180 Mbps | 800 to 940 Mbps | 5× to 10× bandwidth burst |
| Plex transcode plus library scan | 15% CPU | 80% to 100% CPU | 5× to 7× CPU burst |
| ZFS scrub on HDD pool | 40 MB/s | 250 to 600 MB/s | 6× to 15× storage burst |
| Camera NVR with motion events | 70 W / 120 Mbps | 180 W / 350 Mbps | 2× to 3× mixed burst |
| Rule of Thumb | Planning Value | Why It Matters | Check Against |
|---|---|---|---|
| Ethernet practical throughput | About 94% of line rate | TCP/IP, framing, and host overhead reduce usable payload. | Switch ports, uplinks, router WAN/LAN limits. |
| UPS continuous load | Keep below 80% | Leaves runtime, inverter, and battery aging margin. | Buffered peak watts, not average watts. |
| Storage rebuild window | Use observed peak MB/s | Array rebuilds may compete with backups and scrubs. | Controller, disk, pool, and network limits. |
| Power to heat conversion | 1 W = 3.412 BTU/h | Nearly all server power becomes room heat. | Closet ventilation and cooling capacity. |
⚡Planning Tips
This is the burst trap: most builders design for average load. Home servers is sporadic. They idle for hours, followed by a demand for everything all at once. It’s a classic scenario for home server builder.
Just as you think you’ve got it dialed in, you sync that big folder across 10GbE and fire off a ZFS scrub. You stream a 4k movie (with your partner) and update some game server texture. Suddenly, the router fans is screaming and the switch drops packets. That’s the moment you realize your setup are choking on its own success.
How to Plan for Peak Load in Home Servers
It’s the ratio of quiet-to-chaotic that matters, not the absolute specs. Do you have a 15-percent average CPU but a spike to 90 while transcoding? Then you has a six-to-one ratio to account for. That’s where hardware will throttle or fail you. A server with a modest amount of sustained power draw might look like an efficiency purchase, until all those drives spin up simultaneously. That triples the AC load instantly. Average power usage doesn’t matter. What matters is: Will my UPS/circuit breaker handles the peak usage when everything needs juice now?
Feed it the expected peak and the observed average, then let the calculator do the math for you (above). It spares you having to guess at compounding spikes between subsystems. Feed it realistic information, not theoretical maxes. Sure, your mini NAS may only average 50 megs/sec of I/O, but throw an index rebuild into a backup job and that’ll spike to three-hundred easy. Plug those in and the tool will give you its total burst ratio, telling you just how much headroom you really need from your power supply and links.
Run it again, and if it says you “need” much more burst on the network than the capacity of your links, you know why transfers drops packets when writing heavily. Disk arrays also present a narrow bottleneck due to their queue depth. The average workload might be one-and-a-half or twice as large during a quiet storage window, but three or even eight times larger during a heavy period such as a rebuild or scrub. Under a concurrent read/write load, the last thing you need is a drive array thrashing while your network can’t suck down data fast enough.
Often a cheaper alternative to upgrading your hardware is scheduling separation of these workloads. By keeping the backups during hours when scrubs aren’t active, the peak workload never stack up. This keeps it manageable instead of forcing you to buy faster gear.
The same principles applies to power planning, though with even greater potential consequences if things go wrong. You may think a six-hundred-watt UPS is ample, until you learn it’s recommended to keep continuous load under eighty percent to preserve batteries and achieve maximum run time. That means only about four hundred eight watts of available capacity. Your lab might average just seventy-two watts, with a spike up to one-hundred fifty-five when spinning up a drive or boosting the CPU. In that case, all is well. But throw another couple drives into the mix or a beefy network switch that pulls some juice and suddenly that spike could be right on the line between what’s okay and not. The UPS calculator takes into account profile buffers to help you come up with a sensible power plan, one where you’re not hovering on the edge of your UPS’ capabilities.
The same illusion of capacity affects network bandwidth. That gigabit Ethernet port doesn’t represent one gigabit of actual throughput. About six percent of line rate gets consumed by TCP/IP overhead and framing. That leaves you with around nine hundred forty megabits per second. At worst, if a backup job hits the pipe at the busiest time of day when your average usage is low, the effective burst ratio shoots way up. As a result, you must plan for short times when links will be full. You want to make sure that this isn’t at the expense of blocking other critical traffic.
On that page, they lay it all out in a reference table, broken down by subsystem, and the calm/busy ratios is typical. Use it as a sanity check when you feed stuff into it. If your CPU burst ratio is ten times higher than average, there’s probably something amiss with your monitoring/scheduling. If your power ratio never deviates from one point two, you may of been oversizing your UPS all along.
Balance is key. You don’t want to pay for capacity that you’ll only ever use for five minutes a month, but you do want a little bit of headroom to account for inevitable surges. Knowing how these things move makes your collection of gadgets go from fragile to resilient. This allows them to survive their own success.