SNR Calculator
Estimate signal-to-noise ratio, channel noise impact, fade margin, predicted RSSI, and practical Wi-Fi throughput for home lab links.
Calculation Breakdown
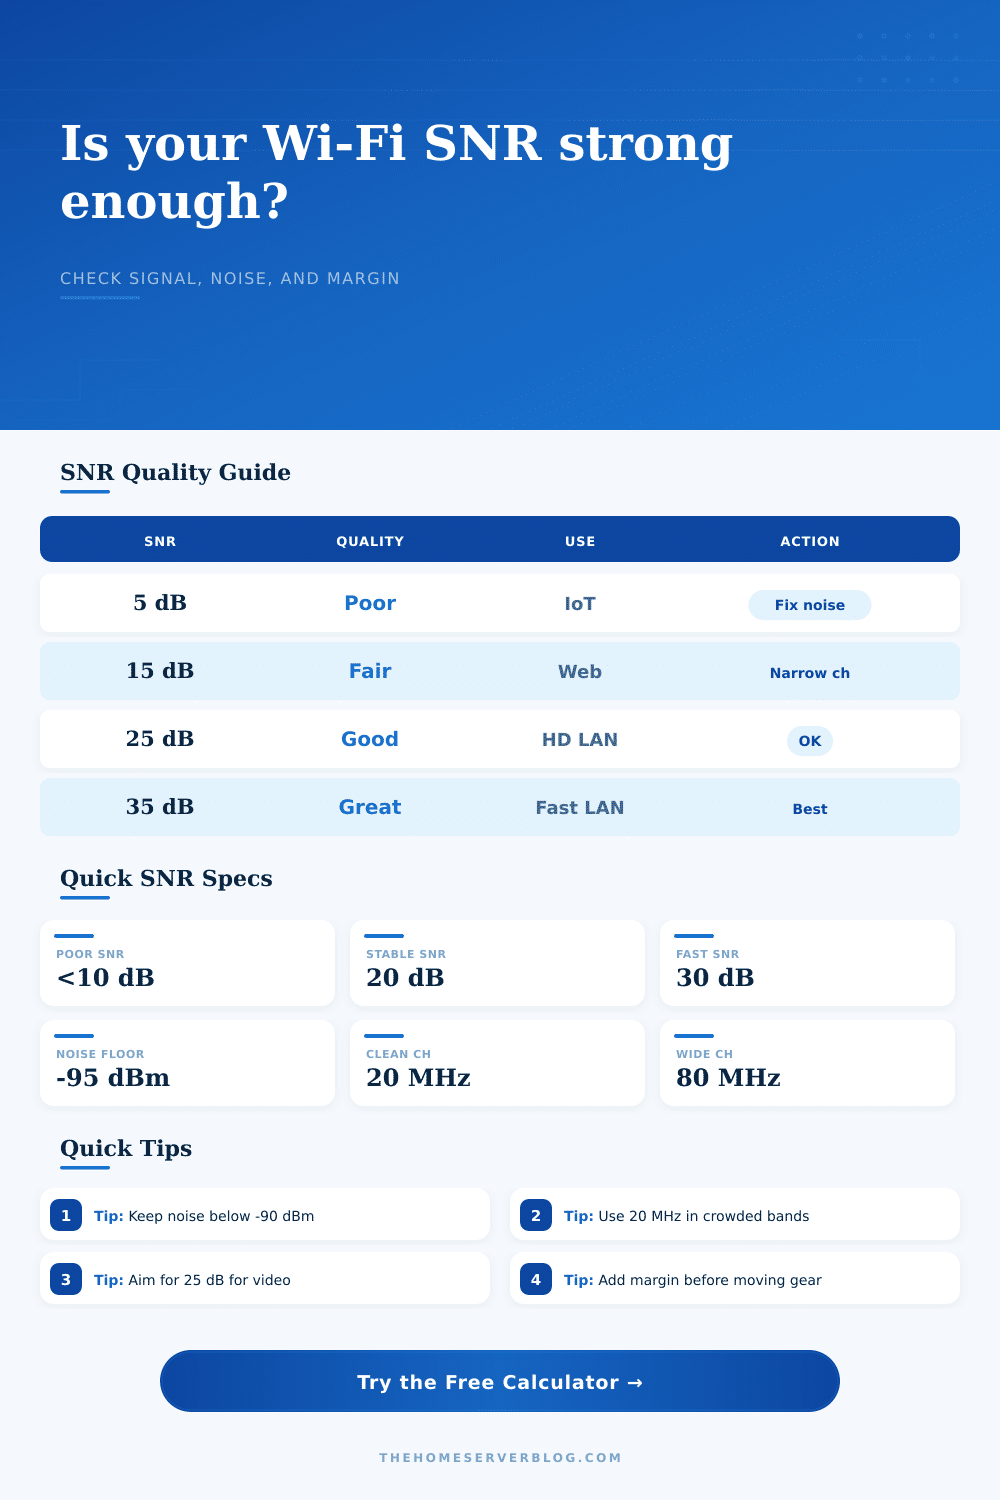
| SNR Range | Link Quality | Typical Home Use | Planning Action |
|---|---|---|---|
| < 10 dB | Poor or unstable | Basic IoT only | Reduce noise, move AP, or narrow channel |
| 10–19 dB | Usable but limited | Browsing, sensors, low-rate devices | Prefer 20 MHz and avoid crowded channels |
| 20–29 dB | Stable | Video, consoles, lab admin interfaces | Good for most managed home networks |
| 30–39 dB | Strong | NAS access, mesh backhaul, fast LAN | Supports wider channels when clean |
| 40+ dB | Excellent | Same-room AP and short backhaul links | Check for client PHY limits before widening |
| Profile | Typical Tx Power | Antenna / Streams | Planning Note |
|---|---|---|---|
| Wi-Fi 5 2x2 AC AP | 18 dBm | 3 dBi / 2 streams | Common ceiling AP and older mesh node baseline |
| Wi-Fi 6 2x2 AX AP | 20 dBm | 4 dBi / 2 streams | Good home office and lab management SSID profile |
| Wi-Fi 6 4x4 AX AP | 23 dBm | 5 dBi / 4 streams | More spatial capacity, but clients still need SNR |
| Wi-Fi 6E 2x2 AX AP | 20 dBm | 5 dBi / 2 streams | Cleaner spectrum, shorter practical range |
| Outdoor directional bridge | 23 dBm | 12 dBi / 2 streams | Useful when path is clear and aligned |
| Item | Reference Value | Practical Limit | Calculator Use |
|---|---|---|---|
| Channel width noise | +3.01 dB per doubling | 20 to 160 MHz | Adjusts noise floor from 20 MHz baseline |
| Free-space path loss | 32.44 + 20log f + 20log d | Best for clear paths | Predicts RSSI from frequency and distance |
| Voice/video RSSI target | About -67 dBm | Client dependent | Compares measured and predicted signal levels |
| Distance conversion | 1 meter = 3.28084 feet | Use same floor path | Normalizes inputs for path loss math |
| High MCS SNR | 30 to 35 dB | Needs clean RF | Grades whether wide-channel throughput is likely |
| Project | Typical Inputs | Primary Result | Secondary Result |
|---|---|---|---|
| Small Home Lab 12U | 5 GHz, 40 MHz, -60 RSSI | Near 30 dB SNR | Stable console and admin access |
| NAS Media Room | 5 GHz, 80 MHz, -57 RSSI | High throughput margin | Good for local media browsing |
| IoT Sensor Shelf | 2.4 GHz, 20 MHz, -72 RSSI | Moderate SNR | Better reliability on narrow channel |
| Garage Access Point | 5 GHz, 40 MHz, -69 RSSI | Low to fair margin | Move AP or reduce wall loss |
| 6 GHz Mesh Backhaul | 6 GHz, 160 MHz, -52 RSSI | Strong if noise stays low | Needs short clean path |
This calculator uses standard dB arithmetic, channel bandwidth noise adjustment, and a free-space path loss estimate for planning. Real homes add reflection, attenuation, and client radio limits.
That’s where signal strength gets complicated. Just because your laptop says it has five bars of Wi-Fi doesn’t mean its internet is fast, and signal strength alone doesn’t tell the whole story. What matters most is your internet’s signal-to-noise ratio (SNR), which tell you just how clear your data is amidst the noise of other internet signals around you. Imagine your signal is voice of a person speaking; the noise is the din of everyone else around them talking. Boosting the volume of the person with the voice won’t help if everyone starts getting louder than too.
Wi-Fi is treated as a form of plumbing by many; more is better. But that’s not how it operate. A greater amount of bandwidth in a wide channel is akin to having more lanes on a highway. However, just because there are lots of lane doesn’t mean they’re usable under adverse conditions.
Why Signal Bars Are Not Enough
This calculator do all the complicated math for you. The calculator uses your equipment specs and the distance between device to create a single number. This number is your effective SNR, which show the impact of ambient noise from wider channels, interference, and walls.
But how do we know? The trick is knowing what we’re measuring. Noise isn’t static. When you increase your channel width, you pick up more of the radio frequency spectrum, this means more interference can creep into your connection. If you double your channel width (from twenty to forty megahertz), for example, you raise the noise floor by approximately three decibels. A small shift, yes; but it makes a difference. While you’ll have the potential for faster speeds, you sacrifice signal clarity. For someone living in a densely populated apartment building, wider channels can actualy hurt your connection.
Reducing your channel width feels counterintuitive; you feel like you’ve stepped back. But it can stabilize your connection and prevent your speeds from dropping out entirely.
The starting line can change based off equipment selection. Devices with Wi-Fi 6 are newer and has better processors than Wi-Fi 5 gear. They also run in a more crowded radio space. The calculator’s presets take those variables into account. They factor in common antenna gains and typical transmit powers. That lets you know whether replacing that simple router with an access point might boost performance. If other nearby networks or appliances makes your noise floor too high, it won’t help. Upgrading hardware only helps when there’s clean air to send.
The fade margin is like a buffer zone. Microwaves firing up, furnitures getting moved around, people walking through rooms, all change signal routes in ways that modeling tools can’t anticipate. To account for such things, the tool adds an additional 10 percent margin. Once you apply this cushion, if your estimated SNR dips below twenty decibels, there’s trouble ahead. Video might start buffering; voice calls will get chopped. Those saved decibels is what could of made the difference between a good connection and a bad one.
Radio waves behave different than in real homes. Large metal racks, massive fish tanks, thick layers of drywall: They will all reflect or absorb radio signals. To test performance, the tool includes some reference tables. Basically anything below ten decibels is going to be useless except maybe for very basic internet of things device.
Don’t get too stuck on the numbers. Think of them as guidelines. Want to reliably stream 4K content? You want something that’s going to protect your link from interference. Just need to check email on your phone? You have more wiggle room there.
Quit staring at signal bars. Start looking at the noise floor. A loud signal in a noisy room is still a poor connection. The ratio of signal to noise makes you stop guessing and begin engineering. You make calls based off clarity, not volume. This change in perspective will typicaly turn an infuriating network into a trusty one. You don’t need more power, you simply need less noise.