HomeServerBlog power planning calculator
Energy Cost Per Server Calculator
Estimate per-server energy use from idle watts, active watts, duty cycle, runtime, utility rate, and infrastructure overhead, then translate the load into fleet totals and heat output.
Full energy breakdown
Good for DNS, Home Assistant, containers, and light Proxmox labs.
Drive count and spin policy usually dominate storage server energy use.
Rack fans, older CPUs, HBAs, and redundant PSUs raise baseline draw.
Accelerators can add large idle losses even before compute jobs start.
Nearly all electrical energy consumed by servers becomes room heat.
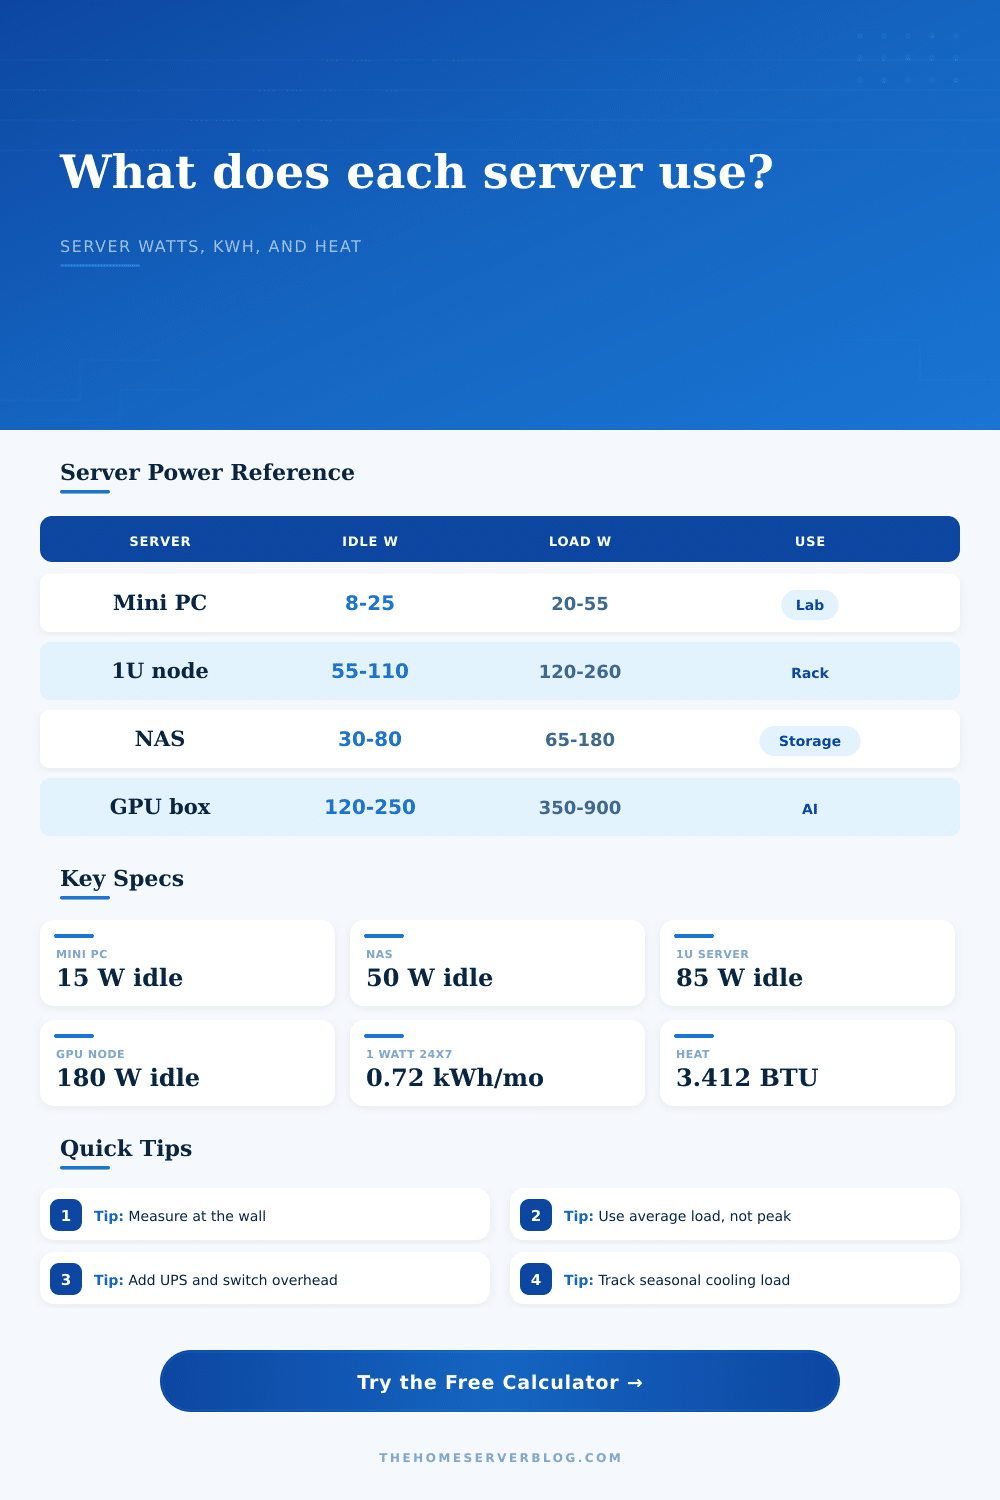
One continuous watt uses about 0.72 kWh in a 30-day month.
Wall draw includes conversion loss, so meter readings beat DC estimates.
UPS loss, switches, fans, and cooling can add 10% to 30%.
| Server class | Idle watts | Active watts | Typical home lab use |
|---|---|---|---|
| Fanless router appliance | 6 to 18 W | 12 to 30 W | Firewall, VPN, DNS, small routing tasks. |
| Mini PC or NUC | 8 to 25 W | 20 to 65 W | Containers, Home Assistant, light virtualization. |
| Micro server node | 20 to 45 W | 50 to 110 W | Low-power cluster, Kubernetes, edge services. |
| NAS with 4 to 8 disks | 30 to 80 W | 65 to 180 W | Storage, backups, media library, snapshots. |
| 1U rack server | 55 to 110 W | 120 to 260 W | VM host, lab services, storage controller. |
| 2U dual-socket host | 90 to 180 W | 220 to 520 W | Dense virtualization, databases, build servers. |
| GPU compute box | 120 to 250 W | 350 to 900 W | AI inference, rendering, transcoding, CUDA work. |
| Always-on draw | Monthly kWh | Yearly kWh | Room heat |
|---|---|---|---|
| 10 W | 7.2 kWh | 87.6 kWh | 34 BTU/hr |
| 25 W | 18.0 kWh | 219.0 kWh | 85 BTU/hr |
| 50 W | 36.0 kWh | 438.0 kWh | 171 BTU/hr |
| 100 W | 72.0 kWh | 876.0 kWh | 341 BTU/hr |
| 250 W | 180.0 kWh | 2190.0 kWh | 853 BTU/hr |
| 500 W | 360.0 kWh | 4380.0 kWh | 1706 BTU/hr |
| Overhead setting | Equivalent PUE | What it covers | When to use |
|---|---|---|---|
| 0% | 1.00 | Server wall draw only | Meter includes no shared equipment. |
| 5% | 1.05 | Efficient UPS loss | Single server on a modern UPS. |
| 10% | 1.10 | UPS plus network share | Most small home lab estimates. |
| 15% | 1.15 | Rack fans and switch share | Several rack servers in one closet. |
| 20% | 1.20 | Warm room cooling margin | Closet, garage, or small server room. |
| 30% | 1.30 | High cooling penalty | Poor ventilation or added air conditioning. |
| Scenario | Count | Average watts | Planning note |
|---|---|---|---|
| DNS and router stack | 1 | 12 to 25 W | Usually cheaper to leave online than to cycle. |
| Small Proxmox cluster | 3 | 20 to 55 W each | Idle optimization matters more than peaks. |
| Media NAS | 1 | 45 to 120 W | Drive spin policy changes the monthly total. |
| Rack VM lab | 2 to 4 | 120 to 300 W each | Schedule idle hosts off when not needed. |
| GPU AI box | 1 | 180 to 700 W | Use runtime windows for bursty compute jobs. |
| Full mixed rack | 8 to 12 | 800 to 2500 W total | Cooling and circuit capacity become primary limits. |
Formula basis: blended watts = idle watts + (active watts - idle watts) x active load share. Monthly energy uses a 30-day month; yearly energy uses 365 days.
So when you started your home lab, you probably started off with one server that you figured would quietly go about its work without much trouble. Your electric bill doesn’t care how excited you are by all this virtualization stuff. What your electric bill cares about is watts. Knowing exactly how much your server is drawing from the wall makes the difference between an affordable hobby and an expensive surprise each month.
And I mean drawing, it is not rated for that. You can glance at a thermal design power rating of your processor and think that’s how much it costs you in terms of electricity. Wrong. That’s a ceiling. It is a ceiling for heat dissipation. It is not a floor for electricity use. In reality, it uses less but it’s also much more variable. After entering your load profile (active vs. Idle) and runtime, just click calculate and let the calculator do the rest. No more guesswork, conversions, or coefficients for you to mess up.
How to Calculate Your Home Lab Power Costs
The other thing folks overlook is that there’s also an invisible load. Odds are you’re not just plugging into your server. You’ve got network switches, uninterruptible power supplies and probably cooling fan to boot. Depending on your setup, that can account for as much as ten to thirty percent of your overall draw. More likely it’ll be on the low end since even a high efficiency UPS with just one little mini PC will stay close to baseline. If you have a small rack in a warm closet then you’ll probably want additional fans so that number goes up. Not taking this layer into account make your numbers look great on paper but wildly off in reality. That’s why the tool allow you to add an overhead factor to the calculation. It models a real-world situation more realisticly than saying everything is perfectly efficient.
A related factor which directly translates to cost is heat. Each watt of power used by your devices translate to heat. When they’re all crowded together in a small space (such as a rack), that heat need to be dissipated somehow. Before long, you’re running air conditioning for the sole purpose of preventing server throttling. The air con costs money and increases your energy bill. This creates a vicious circle where cooling expenses increases electrical consumption. The table on the page is an example of this; it explains how much wattage equals how many BTUs. That allows you to estimate amount of heat being generated. Electricity isn’t just about sending money to the electric company, it’s also about protecting your kit from overheating.
Take these measurements before adding a second GPU or buying another server: use a plug meter to see how much power it actualy draws. Manufacturers’ specs can help you compare hardware, but they’re lousy for creating a budget. Measure the numbers under the exact load you plan to put the system under. Use those numbers as your baseline. Is this going to be a backup server? Model it accordingly. Does it just wake up at 3am for three hours each night? Don’t model it as a twenty-four-hour host. Give it the workload it’s going to have and measure from there.
You should of checked your power first. Accurate inputs lead to an accurate forecast. The mystery evaporates. What you don’t know stops biting you in the ass. The numbers become concrete and tell you a very clear story about your setup. You’ll spend less money and sleep better knowing exactly how much those blinking lights cost you.