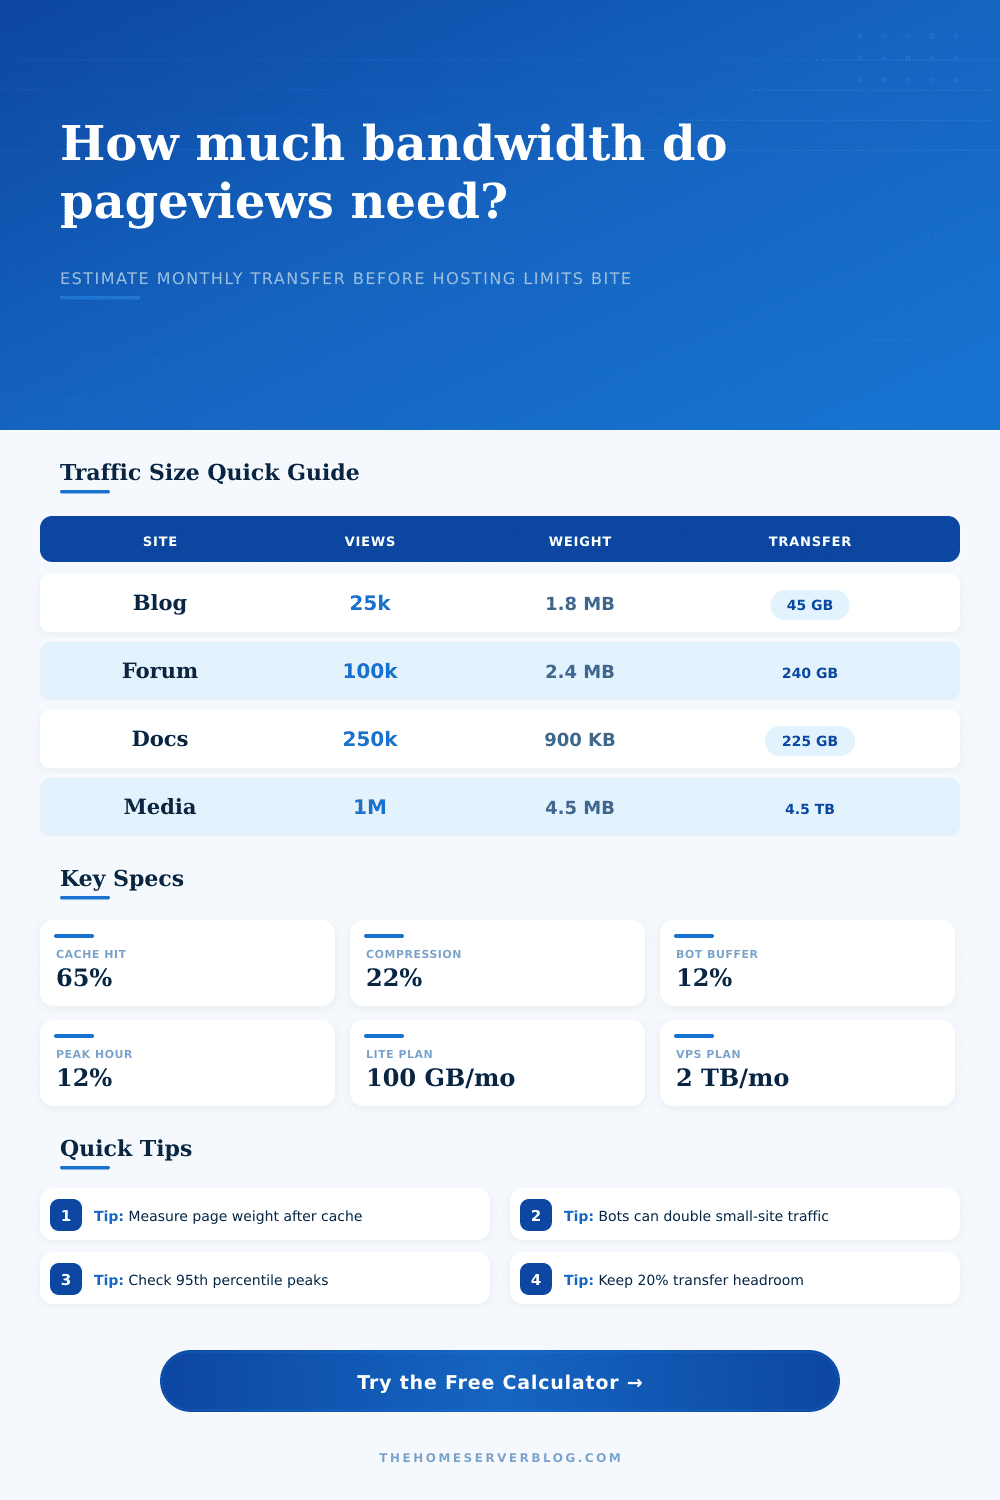
Monthly Pageviews Bandwidth Calculator
Estimate monthly data transfer from pageviews, page size, cache hit rate, compression, bot traffic, peak-hour load, and hosting allowance.
Full Breakdown
| Page Type | Typical Weight | Good Target | Bandwidth Note |
|---|---|---|---|
| Static article or docs page | 0.6 to 1.2 MB | Under 1 MB | Text-heavy pages scale well with compression and edge cache. |
| WordPress blog post | 1.5 to 3.0 MB | Under 2 MB | Theme assets, fonts, thumbnails, and analytics scripts add up quickly. |
| Image gallery or portfolio | 3.0 to 8.0 MB | Under 4 MB | Responsive images and next-gen formats matter more than HTML size. |
| Forum or logged-in app | 1.8 to 4.0 MB | Under 2.5 MB | Authenticated views usually have lower CDN cache ratios. |
| Plan Class | Monthly Transfer | Useful Range | Best Fit |
|---|---|---|---|
| Shared hosting | 100 to 250 GB | Small blogs, docs, low image weight | Good when cache hit rate is high and spikes are modest. |
| Entry VPS | 1 to 2 TB | Busy blogs, small stores, forums | Watch peak Mbps and web server connection limits. |
| High-transfer VPS | 5 to 10 TB | Media sites, downloads, communities | Disk I/O, CPU, and cache misses can bottleneck before transfer. |
| Home server behind CDN | ISP cap dependent | Personal labs, mirrors, niche sites | Upload speed and monthly data caps are the real constraints. |
| Configuration | Origin Load | Peak Behavior | Planning Rule |
|---|---|---|---|
| Origin only | 100% of cacheable and dynamic bytes | Highest CPU, disk, and uplink stress | Keep transfer under 70% of cap for reliable spikes. |
| CDN in front | 20% to 60% with normal cache rules | Static assets offload well; HTML may remain dynamic | Tune cache headers before upgrading hosting. |
| Static edge hosting | Usually below 10% origin pulls | Excellent for launch spikes | Measure egress by provider, not only build storage. |
| Home reverse proxy | Depends on CDN cache and ISP upload | Upload bandwidth can saturate first | Plan around sustained Mbps, not just monthly GB. |
| Measure | Formula | Example | Why It Matters |
|---|---|---|---|
| GB from pageviews | Views × MB / 1024 | 100k × 2 MB = 195 GB | Baseline transfer before cache, compression, and overhead. |
| Peak Mbps | Peak GB × 8192 / 3600 | 10 GB/hour = 22.8 Mbps | Checks whether uplink capacity handles busy periods. |
| Cache offload | Origin bytes × (1 - hit rate) | 60% hit leaves 40% | Separates total visitor transfer from origin transfer. |
| Planning buffer | Calculated use × buffer | 500 GB + 10% = 550 GB | Covers traffic variance, bots, retries, and analytics gaps. |
Gigabytes per month sound impressive when you’re buying hosting plans, but they don’t realy come to life until the day your site is live and you see what one load does. Two terabytes of bandwidth seem like plenty; then you have a traffic spike (or release an image-heavy post) and now your server’s choking on data. Most folks plan based off average usage, not peak real-world scenarios.
They chooses a plan with two terabytes of bandwidth because that sounds like a lot. They fail to realize that bandwidth isn’t just a bucket of water, but also a pipe with a limited size. Pour too much into the pipe and it’ll overflow, regardless of how big a bucket you still have left in the month.
How to Choose the Right Hosting Plan
It’s up to you to enter in your page weight and page views, at which point the calculator (above) does the math for you, saving you from having to guess around with conversions and coefficients. And it reminds you of the unseen weight of your website. Rarely are page weights simply those HTML text files. Every thumbnail image, font download, JavaScript library, CSS file. All of these load with each request and are part of the page weight.
A basic blog post could be one-megabyte; add an unoptimized hero image or a heavy analytics suite and you could triple that weight. But it scales with every visitor, making the increase matter more then before.
The true saving is in cache hit rate. If an asset has been cached in a browser cache or through a content delivery network, it won’t be served from your origin servers again. Your estimate will account for this with higher cache efficiency leading to fewer requests being sent to your origin server.
If there’s a 60% hit rate, then only 40% of the possible load will go to your server. That’s why optimizing your cache headers is so powerful (as opposed to purchasing additional bandwidth). It isn’t that you’re actualy sending less data, it’s just that all the hard work gets offloaded to the edge.
Oh yeah: include invisible guests. Humans aren’t the only users gobbling up bandwidth; bots, crawlers and scrapers do too, but not in a way that generates money. These things asks for pages, scrape feeds and check your uptime 24/7. There’s an option on the calculator for including the bot overhead.
For small sites, that could be a large part of your overall traffic. Fail to take them into account and you’ll always predict less than what actualy happens. It is a little thing, but it is important when you’re operating inside a narrow cap.
Traffic spikes cause another set of issues. Even if you’re getting enough total data each month, high-volume hours may fill up your network interface and overwhelm your server with constant flow. The distinction here is between driving around with a full tank of gas versus drinking from a straw… In both cases, your tank has plenty of fuel; but in one case, you can’t get it fast enough.
Even if you’ve got enough monthly quota, a spike of users will timeout while waiting on page assets, resulting in a lousy user experience due to a slow uplink.
But there’s also compression. Web servers these days compresses text-based files (like.js or.css) using Gzip or Brotli, shrinking them down before they get sent out over the wire. That reduces the number of actual bytes that travel over the connection. So you can specify a percentage of compression savings as input into the tool.
How much it saves depends on content type… Images and videos don’t gain much, but things like JSON or HTML will compress quite nicely. If you know what your mix is, you’ll be able to have more realistic expectations about how many bytes it will save.
Here is a list of reference tables for each type of hosting plan: Static websites with very little traffic are fine on shared hosting plans, but if you’re running a store or a forum, you’ll want some sort of VPS plan so that you can get the room required. In general, try to align your hosting plan with how much traffic you expect.
If you run a dynamic app, you’ll require more powerful servers; if your site is mostly static and served out of an edge network, you won’t be hitting the origin very hard. Knowing this helps avoid buying too much (and paying for resources you don’t use) or buying too little (which results in bad performance).
So instead of thinking in terms of pure bytes, think in terms of flow. How fast are you moving? What’s helping you move that data faster or slower? What do you expect to bring down the load? With those answers, you start to have a better idea of how much you really need. Then you can adjust for peak usage, bots, and caching. And you begin to see hosting as a fixed cost rather than something that could of shocked you when you hit a cap.
That’s why all the work on gathering input matters. The clarity is priceless.