DCiE Calculator
Estimate Data Center Infrastructure Efficiency from IT load, cooling power, UPS losses, support overhead and planning buffer.
⚡Data Center Efficiency Presets
🔧Efficiency Inputs
Full Efficiency Breakdown
🗄Equipment and Spec Comparison Grid
Small split cooling, compact UPS, limited airflow separation.
In-row or ducted cooling and a modern online UPS.
Metered power paths with shared plant and aisle containment.
Short power distribution and tighter supply air control.
Economizer hours reduce compressor power across the year.
High UPS loading, optimized fans and dedicated plant controls.
Modern double-conversion units often peak near high utilization.
Equivalent to roughly 77% DCiE before planning margin.
📊Reference Tables
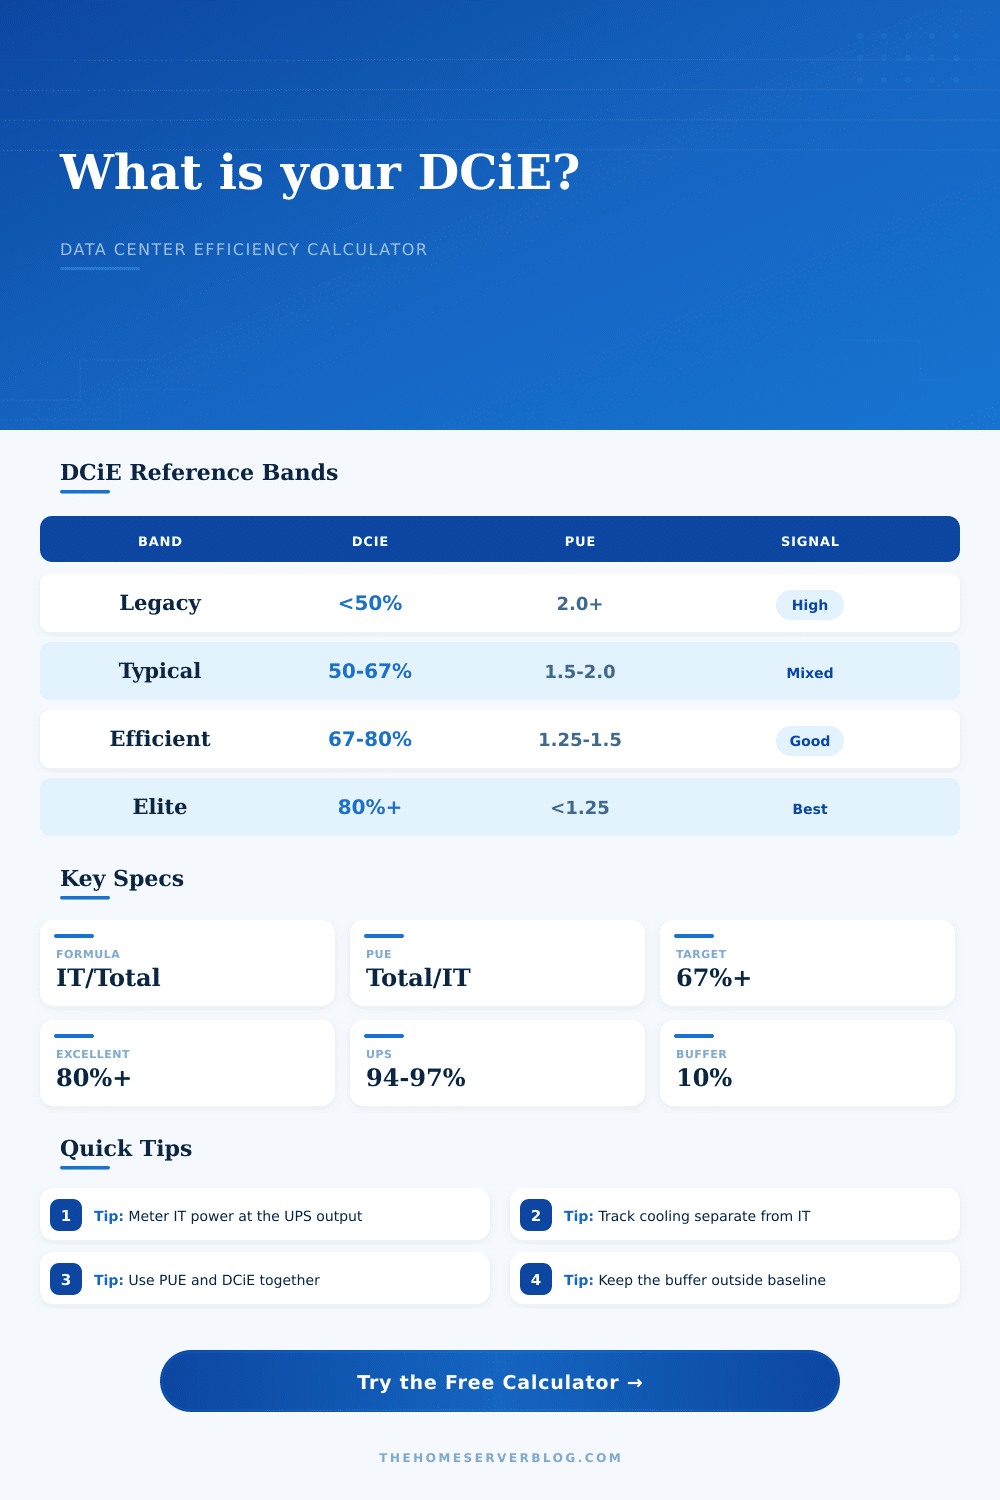
DCiE and PUE interpretation
| Efficiency band | DCiE range | PUE equivalent | Planning signal |
|---|---|---|---|
| Legacy or lightly managed | Below 50% | Above 2.00 | Cooling and power path review usually pays back in capacity. |
| Typical small data room | 50% to 67% | 2.00 to 1.50 | Good baseline for closets, labs and mixed legacy gear. |
| Efficient dedicated space | 67% to 80% | 1.50 to 1.25 | Common target for well-metered rooms with containment. |
| Highly optimized facility | Above 80% | Below 1.25 | Requires sustained controls, efficient UPS loading and cooling design. |
Capacity by facility configuration
| Configuration | Typical IT load | Facility power at target | Metric equivalent |
|---|---|---|---|
| Office IT closet | 3 to 15 kW | 5 to 28 kW | 0.003 to 0.015 MW IT |
| Small server room | 15 to 75 kW | 24 to 125 kW | 0.015 to 0.075 MW IT |
| Colocation cage | 75 to 300 kW | 105 to 450 kW | 0.075 to 0.300 MW IT |
| Modular data hall | 0.3 to 2.0 MW | 0.38 to 2.7 MW | 300 to 2000 kW IT |
Standards and conversions for efficiency math
| Item | Formula or value | Use in DCiE | Practical limit |
|---|---|---|---|
| DCiE | IT power ÷ total facility power × 100 | Higher percentage means more facility power reaches IT. | Always use the same metering interval. |
| PUE | Total facility power ÷ IT power | Reciprocal of DCiE when using the same boundary. | Lower is better; 1.00 is theoretical ideal. |
| UPS loss | IT load ÷ UPS efficiency minus IT load | Captures conversion loss before downstream cooling effects. | Varies strongly with UPS loading percentage. |
| Thermal output | 1 kW equals 3412 BTU per hour | IT load becomes heat that cooling must remove. | Use measured IT power, not nameplate watts. |
Common project sizes
| Project | Equipment count | Primary result | Secondary result |
|---|---|---|---|
| NAS and firewall closet | 4 to 8 devices | 40% to 55% DCiE | 1.8 to 2.5 PUE if cooling is oversized. |
| Proxmox lab rack | 8 to 16 devices | 50% to 65% DCiE | UPS and fan losses become visible. |
| Small business server room | 2 to 6 racks | 58% to 72% DCiE | Aisle control improves repeatability. |
| Contained colocation row | 8 to 24 racks | 67% to 78% DCiE | Shared plant efficiency raises the baseline. |
💡Calculation Notes
The server rack has been carefuly built out. It have fast processors, the right drives, and solid network switches. Once you plug it in a large part of your electric bill goes toward unseen overhead. Welcome to data center physics.
Your equipment create heat. Your infrastructure moves that heat away using power that you don’t see. Whether you are lean or spendy depend on how well you understand the difference between doing something useful and wasting money based off the process.
How to Calculate Your Data Center Efficiency
Power Usage Effectiveness (PUE) is the most commonly consulted number, which is fine, PUE tell you how many watts it takes to draw all the power in the building vs. How many watts go to powering your actual IT equipment. If it’s 1.0 then there’s no waste. If it’s 2.0 then half goes to compute and half goes to cooling/supporting that computer. That number, while useful, can be somewhat abstract if you’re reviewing a sheet of numbers in budget spreadsheet.
Once you put in the numbers that matter to you (your load, your overheads), DCiE calculator does the math for you. It translates those dry numbers into a clear efficiency percentage that you’ll find easier to justify in boardroom. That said, there’s really only one trick, which is knowing what you’re measuring.
Servers are not the only thing that is part of your IT load. Your IT load is everything that’s plugged in (and drawing current) in your datacenter, such as all those network cards, storage arrays, and switches. When you measure at input to the UPS, you’re including losses due to the conversion process in your IT number. That skews efficiency score upwards in a misleading manner. Instead, you want to measure the power going to actual load.
The calculator makes that distinction very clear: You put in your IT load. Then you add on support overhead, UPS losses, and cooling plant power. Each of those are a real dollar cost that will scale in line with your usage. Typically that’s the big one: Cooling.
At an extreme, it doesn’t matter how hard the servers work, the AC in the server room will be blasting away all day long, no matter what. On the other end of the spectrum, you’ve got dynamic cooling systems responding to the heat output of the servers, which work great if they’re in a hyperscale hall. According to the reference table below, this affects your overall score based off the profile of your facility.
If you have an edge micro rack and the cooling system is too large for small IT load, then you may only reach 50% efficiency. Tight containment and a modular pod with multiple server can surpass 75%. This isn’t just a question of purchasing good equipment; it’s a question of ensuring that the size of the support systems matches the size of the demand.
And then there’s efficiency. The quiet killer is that UPSs is not perfectly efficient (a lot of power gets turned into heat while converting). Old double-conversion models are even less so. Newer ones gets up to 96%+ and more if they’re used correctly. So make sure yours isn’t sitting on only 20% load… It’ll be inefficient. Make sure it’s on 80%, that’s its sweet spot for high efficiency. You can tweak this number on the calculator and check out what it actualy costs in overhead. That couple percentage points of inefficiency may not sound like much on paper, but multiply by however long it runs every day, all year, and it amounts to thousands of dollars lost.
There’s overhead support too: monitoring gear, security systems, lighting, etc. Not much, but it’s always on. Add in some planning buffer. Don’t design a facility so that it chokes when you finally scale up. When you’re rarely running at 100% capacity, leaving a 10% buffer in your calculations is smart. The tool handles this by adjusting the total facility power requirement before calculating final efficiency ratio.
But you don’t have to get it perfect. Progress is what matters. With some simple airflow management and improved metering, you can move from a low score (legacy) under 50% up to the average of 67%. To reach that elite status over 80%, you’ll really have to buckle down on controls, have free cooling available, and make some dedicated design efforts.
Before you can improve, however, you should of find out where you’re starting. Examine your meters. Separate out cooling vs. IT load. Maintain consistent boundaries. The numbers themselves will show you right where your money is being spent.