Path Loss Exponent Calculator
Estimate RF and Wi-Fi attenuation from measured RSSI, transmit budget, frequency, and distance.
Path Loss Results
| Environment | Typical exponent | Practical reading | Planning note |
|---|---|---|---|
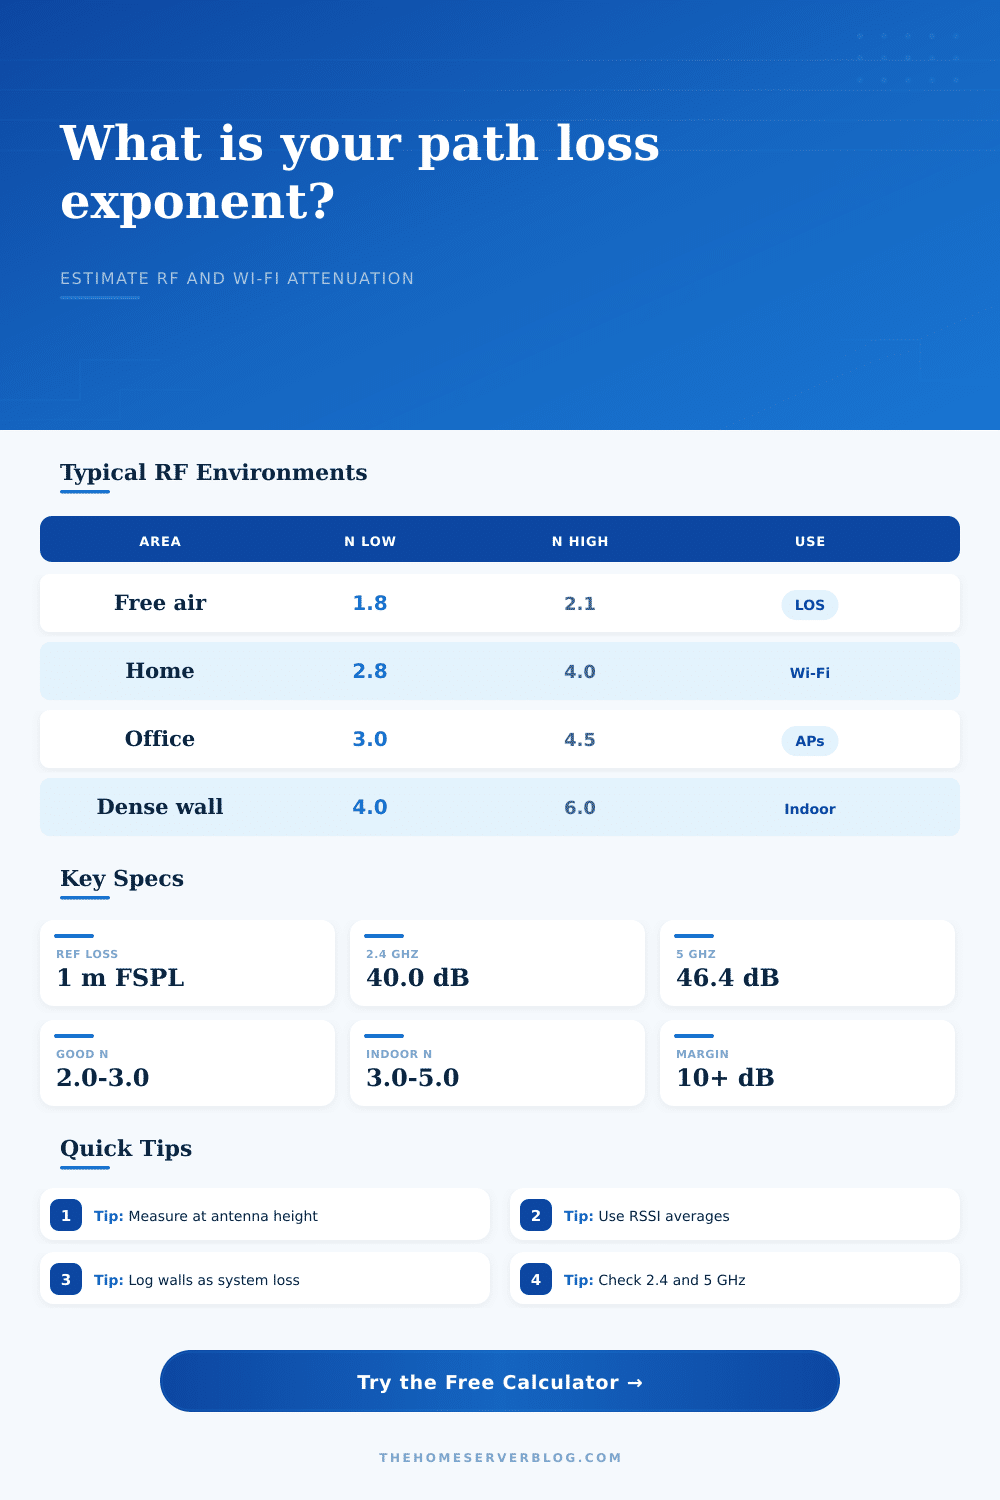
| Free-space line of sight | 1.8 to 2.1 | Very efficient propagation | Outdoor test range or clear hallway |
| Suburban yard | 2.2 to 3.0 | Light clutter or foliage | Mesh nodes can often stretch farther |
| Drywall apartment | 2.8 to 4.0 | Common indoor Wi-Fi loss | Room-to-room AP placement matters |
| Brick or concrete interior | 4.0 to 6.0 | Fast signal decay | Prefer wired backhaul or more APs |
| Band | 1 meter FSPL | Common use | Path loss note |
|---|---|---|---|
| 900 MHz ISM | 31.7 dB | Sensors, telemetry | Lower reference loss than Wi-Fi |
| 2.4 GHz Wi-Fi | 40.0 dB | Coverage, IoT, legacy clients | Better penetration than 5 GHz |
| 5.18 GHz Wi-Fi | 46.7 dB | High-throughput clients | Needs tighter AP spacing |
| 6.5 GHz Wi-Fi | 48.7 dB | Wi-Fi 7 wide channels | More sensitive to walls and floors |
| RSSI target | Typical service | Minimum margin | Field interpretation |
|---|---|---|---|
| -55 dBm | Dense high-speed Wi-Fi | 10 dB | Excellent signal if noise is low |
| -67 dBm | Voice, video, roaming | 8 to 12 dB | Common design target for homes |
| -75 dBm | Basic data and IoT | 6 to 10 dB | Usable but less forgiving |
| -85 dBm | Low-rate telemetry | 3 to 8 dB | Edge of reliable operation |
| Project type | Equipment count | Primary check | Secondary check |
|---|---|---|---|
| Single home router | 1 AP | Room-edge n value | RSSI above -67 dBm |
| Two-node mesh | 2 radios | Backhaul exponent | 10 dB fade margin |
| Garage bridge | 2 panels | Outdoor n near 2 | Fresnel clearance |
| Basement lab Wi-Fi | 1 to 3 APs | Floor loss included | Separate 2.4 and 5 GHz runs |
In the corner of the room, you reach for your phone. There’s a barely detectable Wi-Fi signal. It’s coming from router about thirty feet away behind a bookshelf, but it’s slow.
Why? Because radio waves is blocked by physical objects. The rate of that decline are measured by a number: the path loss exponent. If you’re outdoors in open space, it’s about two. Indoors in a house filled with metal and walls, it’s four or five. Use a calculator to get an idea of what it might be where you are. That eliminate guesswork in planning out networks.
Why Your Wi-Fi Signal Gets Weak
To accurately read the signal you have to do it twice. One meter out you read one value then further away (say twelve meters). Then you work out difference in values. How rapidly does the signal reduce? Well if it’s rapid that means the exponent is high. In other words, each additional foot of distance cost a lot of signal strength. You use this information to position your routers properly.
Because if your exponent are higher, one router won’t reach far enough. And since it fades rapidly you’ll need multiple router positioned closely together.
Most people don’t realize how much frequency impacts signal strength. The 2.4 gigahertz and 5 gigahertz signals is different. Higher frequencies (shorter wavelengths) is more prone to being absorbed by people and furnitures. At one meter, the 6 gigahertz bands lose more signal than the 2.4 gigahertz bands. You can see this in reference table. In other words, to provide same coverage, high speed Wi-Fi require a better path.
Planning for 2.4 gigahertz performance on 6 gigahertz gear result in dead spots that weren’t there previously.
The other thing many people don’t take into consideration is antenna gain. Even if you have a powerful router, poor antennas will cuts down the power. You can enter the antenna gain (both transmit and receive) so it include that in its calculations.
In point-to-point links, a directional antenna can helps focus the signal. Inside, omnidirectional antennas typically work best. They provide wide coverage instead of a narrow beam. Match the room’s shape to the antenna pattern or you’ll end up with good signal near ceiling but weak near your desk.
Small but important reductions occurs due to system loss. That includes things like cable losses, connector degradation, and even your own body blocking a signal. When you hold a phone, part of its signal gets absorbed by your hand. When a laptop is placed on a desk, its case block antennas. These reductions are small, maybe three or four decibels… But they accumulate. Don’t forget about them and you’ll have a thinner connection margin than you think.
Ten decibel are a good target for stable connections. It gives you space for background noise and other changes in the environment. Lose that margin and your connection will start dropping packets whenever the environment change even slightly.
The problem with most home networks is that they presume perfect conditions. I would of like my signal to go to all the rooms of my house. According to physics, that’s theoretically possible, but according to how signals weaken over distance, it’s expensive.
When you measure real-world signal degradation, however, you’re able to configure your network properly. You’ll know exactly how many access points you need, and where to position them. You’ll know what frequency band to use where. You’ll stop cursing your internet provider and take responsibility for the physical configuration.
Sure, the signal will still degrade. It always does. But at least you’ll understand why it degrades, and how to add equipment to compensate.
Actually, its better if you plan ahead.