NetFlow and IPFIX Sizing
NetFlow Storage Calculator
Estimate daily flow-log volume, retained disk footprint, write rate, and collector headroom from exporters, flow rate, record size, sampling, compression, and retention.
▣NetFlow/logging presets
⚙Flow collection inputs
Full breakdown
▦Equipment/spec comparison grid
Embedded Router Log Disk
Good for low-rate raw exports or short diagnostic windows on appliance storage.
Raspberry Pi 5 + SSD
Works well for nfdump, pmacct, or light ClickHouse with USB SSD storage.
Mini PC NVMe Collector
Balanced home lab target for VLAN labs, firewall telemetry, and month-long search.
NAS VM on HDD Pool
Fine for compressed retention, but random search can be slower on shared disks.
NUC Search Stack
Useful for enriched fields, dashboards, and frequent queries over recent data.
1U Xeon Collector
Comfortable for sampled 10G cores, multiple exporters, and heavier indexing.
Cloud VM Standard Disk
Easy for remote access, but watch sustained write limits and egress-heavy queries.
Object Archive Tier
Best for compressed long retention after hot data rolls off the collector.
ℹRecord and sampling reference
| Flow source | Typical emitted FPS | Average record size | Storage note |
|---|---|---|---|
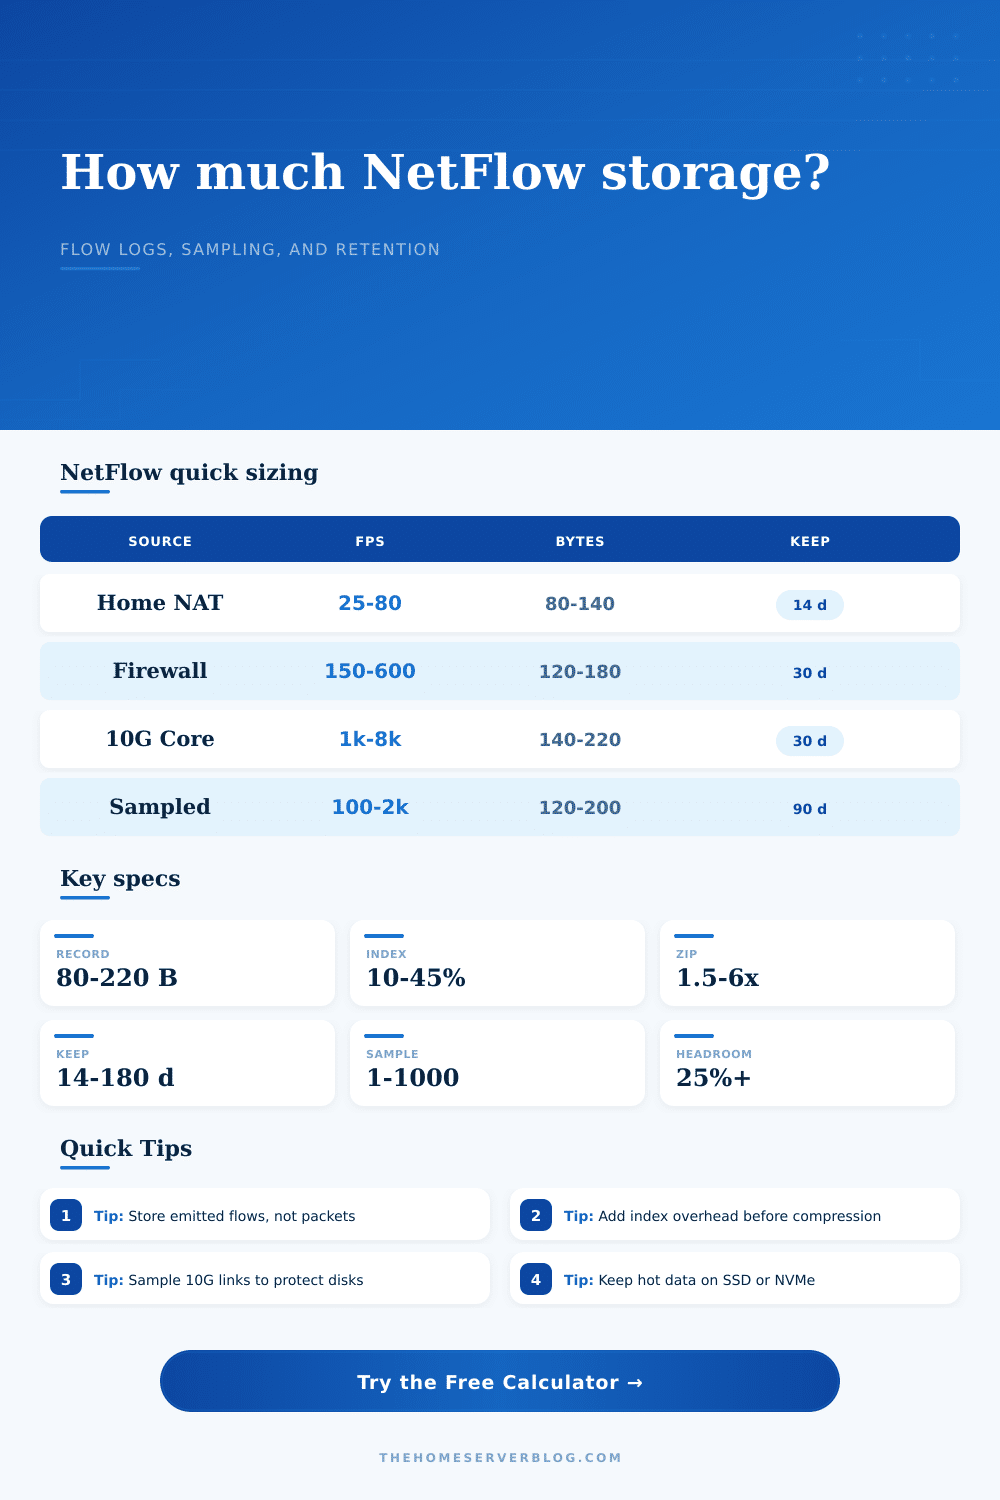
| Home NAT gateway | 25 to 80 flows/sec | 80 to 140 bytes | Usually safe unsampled with short retention. |
| Stateful firewall with VLANs | 150 to 600 flows/sec | 120 to 180 bytes | Index overhead matters when tagging interfaces and zones. |
| Virtualization host or vSwitch | 250 to 1,200 flows/sec | 120 to 200 bytes | East-west traffic can raise flow rate without raising WAN use. |
| 10G switch core | 1,000 to 8,000 flows/sec | 140 to 220 bytes | Sampling is common when bursts are frequent. |
| Sampled edge export | 100 to 2,000 emitted flows/sec | 120 to 200 bytes | Disk stores sampled records; traffic estimate scales by sample ratio. |
🗄Collector profile table
| Collector profile | Flow ingest target | Reserve added | Practical disk class |
|---|---|---|---|
| Embedded Router Log Disk | 1,500 flows/sec | 5 GB | Appliance flash or small SSD |
| Raspberry Pi 5 + SSD | 6,000 flows/sec | 15 GB | USB 3 SSD |
| Mini PC NVMe Collector | 25,000 flows/sec | 50 GB | NVMe SSD |
| NAS VM on HDD Pool | 12,000 flows/sec | 80 GB | NAS pool with SSD cache |
| NUC Search Stack | 50,000 flows/sec | 120 GB | NVMe SSD, preferably mirrored |
| 1U Xeon Collector | 120,000 flows/sec | 250 GB | Enterprise SSD or NVMe |
⏱Retention and compression guide
| Use case | Retention window | Compression target | Comment |
|---|---|---|---|
| Troubleshooting only | 7 to 14 days | 1.5x to 2.5x | Prioritize recent query speed over deep history. |
| Home lab trend review | 30 days | 2.5x to 4x | Good balance for dashboards and anomaly checks. |
| Security investigation | 60 to 90 days | 2.5x to 4x | Leave headroom for extra tags and enrichment. |
| Long archive | 180 days or more | 4x to 6x | Move older segments to compressed object or NAS storage. |
⚖Common project sizes
| Project | Exporter count | Starting FPS | Suggested collector |
|---|---|---|---|
| Single home router | 1 | 25 to 80 per device | Embedded disk or Pi + SSD |
| Firewall plus managed switch | 2 to 3 | 100 to 250 per device | Pi + SSD or mini PC |
| Proxmox and NAS lab | 4 to 6 | 250 to 900 per device | Mini PC NVMe collector |
| Sampled 10G core | 2 to 5 | 1,000 to 5,000 emitted per device | NUC search stack or 1U collector |
✔Storage sizing tips
NetFlow, sFlow, and IPFIX collectors vary by parser, fields, tags, and database engine. Treat the result as a sizing target, then validate with a day of real exports before committing long retention.
NetFlow shows what passes through your network and where it goes. If something doesn’t look right you collect some Netflow data. Seems easy enough, right? Until you get a storage drive hooked up, and after three days its filled up.
Often the problem isn’t with the data so much as it is failing to consider hidden multipliers which can cause even a modest flow rate to become a storage issue. Flow logs are treated by most home lab enthusiasts as static text file. They’re not static files. They are a dynamic record that expands based on both tags applied and fields enabled.
How to Plan Your Network Storage
To understand how it works, isolate the variables. On one side, you’ve got your flows per second coming out of each exporter (the device from which data originates). Then there’s the size of the records flowing out. Depending on if you’re using old NetFlow v5 format, or the newer, more moddern IPFIX format, this will vary widely. And finally, you have the collectors receiving the data. How much flow per second are you getting? Where are they located? Do you have a redundant site?
The page calculates answer for you. It takes all of this as input. Along with retention times and compression ratios, and spits out a real-world disk requirement. But unless you know what drives those inputs, you won’t understand the math. You shouldn’t trust the answer blindly.
After all, sampling isn’t simply a number; it’s a tradeoff. If you sample at 1:1, then you capture everything but you’ll overwhelm a low-end collector. Sample at 1:100 and you save disk space but risk missing brief connection that signals an intrusion attempt. You need to know what kind of truth you want based off your own specific use case.
Another source of confusion is compression. Many people think it saves space linearly. In fact, it’s impossible to compress flow data until it has been indexed. First the collector has to go through the records and add some metadata to them. Then it creates indexes for searching.
That’s called index overhead. It’s the silent killer when you plan for storage. You will likely ignore it, size your drive by raw bytes, and find yourself 30 percent short in a week. The page has a reference table laying it out. It shows how different collector profiles takes into account this metadata burden.
Light logging can be handled by a Raspberry Pi, but try to add lots of heavy indexing and it will go to a crawl. You have to balance the price of storing the data versus the speed of retrieving it. Spinning disks is terrible at random I/O, so frequent queries require fast NVMe drives. However, without rotating out old data, those same NVMe drives will run out of capacity much quicker.
How long you want to retain data also determines how much you’ll spend on hardware. To troubleshoot recent problems, thirty days of data is often good enough while still not too costly. If you need to extend that to ninety days or longer, you’ll need a multi-level solution. Hot data will remain on fast local storage so it’s immediately accessible. Cold data will get migrated to lower-cost, slower media where it can remain compressed and mostly unaccessed. Two years of searchable flow logs stored on a single consumer-grade SSD isn’t just expensive; it’s a recipe for poor performance and premature drive death.
Consumer SSDs has limited write endurance, and flow logging is a constant, relentless write operation.
And then there’s the issue of collector headroom. Don’t ever size your collector to run at maximum capacity. Flow rates can increase dramatically during a software update, or backup window. Your collector will drop packets if it’s already maxed out and dropped flows are worse than no flows. They leave holes in your timeline making forensic analysis pretty much impossible. Having 25% or more headroom guarantees that transient spikes won’t ruin your data integrity. A little bit of buffer buys you a lot of peace of mind.
How complex do you want to get? That’s where the collector profile matters. If you’re OK with relatively basic queries, then sticking something together on a Raspberry Pi like nfdump is low maintenance and will get the job done. But you don’t have many bells and whistles there (for example, you can’t really search). If you need rich search functionality, something like an Elasticsearch based stack running on a NUC requires more configuration as well as more resources.
Ultimately, the tool will help guide you towards matching your expected flow rate with a corresponding class of hardware. However, it won’t make that decision for you. Do you care about real time anomaly detection? Or are you only interested in having a historical record that you can go back and look at following an incident?
Ultimately, it’s all about setting your expectations around storage size. No unlimited everything for free, got it? Pick two: unlimited resolution or unlimited retention or zero cost.
Start with a minimal viable data set, see what your real growth looks like in a week, and add more as needed. Better to add drives when you need them rather than starting with a choking system from day one. Aim to provide sustainable visibility, not a full hard drive. Keep your headroom generous, your cold data cheap, and your hot data fast. That’ll keep the logs flowing and the lights on.