HomeServerBlog storage reliability calculator
Annualized Failure Rate Calculator
Estimate annualized failure rate from observed failures, device-years, duty cycle, storage capacity, and workload, then compare the result with common HDD, SSD, NAS, and public fleet reference points.
Full AFR breakdown
Public field fleet baseline for comparison.
Calculated from the selected AFR when a datasheet value is absent.
Annualized per-device transfer limit or practical comparison point.
Use as a sanity check, not a replacement for your own logs.
| Reliability profile | Reference AFR or MTBF | Workload reference | Best fit |
|---|---|---|---|
| Seagate Exos X20 enterprise HDD | 0.35% AFR, 2,500,000 hour MTBF class | 550 TB/year class | 24x7 enterprise storage shelves, ZFS pools, backup servers |
| WD Red Pro NAS HDD | 2,500,000 hour MTBF class, about 0.35% exponential AFR equivalent | Up to 550 TB/year on newer high-capacity models | Always-on NAS arrays with vibration-aware drive firmware |
| Backblaze lifetime HDD fleet | 1.31% lifetime AFR reference reported with public drive stats | Real data center duty, model mix dependent | Large fleet sanity check for observed drive replacements |
| Aging 8TB field group | 3.04% quarterly group AFR reference from older 8TB fleet behavior | High age sensitivity | Older refurbished disks, secondhand shelves, lab spares |
| Consumer SATA SSD | 1,500,000 hour MTBF class, about 0.58% exponential AFR equivalent | TBW and write workload matter more than HDD duty hours | Boot mirrors, cache devices, light VM datastores |
| AFR band | Expected failures on 100 drives | Equivalent MTTF per device | Interpretation |
|---|---|---|---|
| 0.20% to 0.50% | 0.2 to 0.5 per year | About 200 to 500 device-years | Excellent fleet result, but still plan for replacements |
| 0.50% to 1.50% | 0.5 to 1.5 per year | About 67 to 200 device-years | Common healthy field range for many mixed HDD pools |
| 1.50% to 3.00% | 1.5 to 3.0 per year | About 33 to 67 device-years | Watch age, workload, heat, and rebuild history closely |
| 3.00% to 6.00% | 3.0 to 6.0 per year | About 16 to 33 device-years | High enough to affect spare planning and backup cadence |
| Above 6.00% | More than 6 per year | Less than 16 device-years | Investigate batches, chassis, power, cooling, or handling |
| Storage layout | Failure tolerance | Rebuild exposure | AFR planning note |
|---|---|---|---|
| Single disk or single SSD | 0 failed devices | No redundancy window | AFR becomes restore frequency; backups are the recovery path |
| RAID1 or ZFS mirror | 1 failed member per mirror | Low to moderate, depends on capacity and workload | Track pair age and avoid replacing both mirror sides with same batch |
| RAID5 or RAIDZ1 | 1 failed device | High during full rebuild or resilver | Higher AFR and large disks argue for stronger parity |
| RAID6 or RAIDZ2 | 2 failed devices | Moderate; second failure is tolerated | Good default for many large HDD home server pools |
| RAID10 or striped mirrors | One per mirror pair | Fast rebuilds when mirror pairs are balanced | Failure location matters, not just annual count |
| Observation size | Why it matters | Zero-failure upper bound | Practical read |
|---|---|---|---|
| 10 device-years | Tiny sample | About 26% | One small NAS with no failures cannot prove a low AFR |
| 50 device-years | Small lab sample | About 5.8% | Useful for local tracking, still wide for prediction |
| 100 device-years | Moderate sample | About 3.0% | Good for comparing shelves, batches, and replacement periods |
| 500 device-years | Strong home or SMB fleet sample | About 0.6% | Now zero failures says something meaningful |
| 5,000 device-years | Large public fleet scale | About 0.06% | Model-level conclusions become much more stable |
AFR is a population planning metric. Individual drives still fail unpredictably, so use it for spares, replacement rhythm, redundancy, and backup testing rather than for single-device guarantees.
Yes, storage drives fail. And no, you don’t have to be a statistician to know that they do. All you really need is enough drive operating for enough time to prove the point.
When discussing reliability, though, what exactly are we talking about? Most of us usually assume there is a bad batch when we see a failing drive. A more experienced administrator, however, understands that he or she’s witnessing a pattern of chance catching up to a particular unit.
How to Plan for Drive Failures
This calculator translate raw failure events into language that can be used for planning. It moves you from panic mode to predictive mode.
Device years are key to understanding how failure rates work. That’s what most people misunderstands. One thousand devices running for one year? You’ve got one thousand device years of exposure to failure. Ten devices running for a hundred years? Same amount of statistical information.
The number of devices doesn’t matter. Time matters. Your data matters. And yes, the calculator does all that math for you, it’ll convert your observation window and duty cycle into proper denominator. It will keep you from over-estimating during a short-term test.
So think about how much temperature varies between a drive in a cold server rack versus a warm and cozy closet. Think about how vibration differs. And think about how much workload matter. If you have two drives that are exactly alike, the one churning out five-hundred terabytes per year will wear out sooner then the one lying dormant.
This is why you need this tool to ask you about your yearly workload and then add a bit of stress buffer. You should of considered this. The numbers that appear on a datasheet don’t often fare well once they leave theory and enters reality. This isn’t simply a measure of mechanical failure. This is a measure of a device decaying while subjected to the specific abuse you’re heaping upon it.
And then there’s the question of what “zero failures” even entails. Maybe you’ve got a little home server going and haven’t had any problems for a year. Great! Congrats! But the calculator will tell you that sample size are too small to say much one way or another. A zero-failure rate for a tiny fleet has a very wide upper bound. It could be that you’re extremely lucky, or that the drives is just perfect.
This is why the tool displays its confidence limit; so you don’t base expensive purchase decisions on silence alone. Silence is data but it’s weak data until you have a larger sample size.
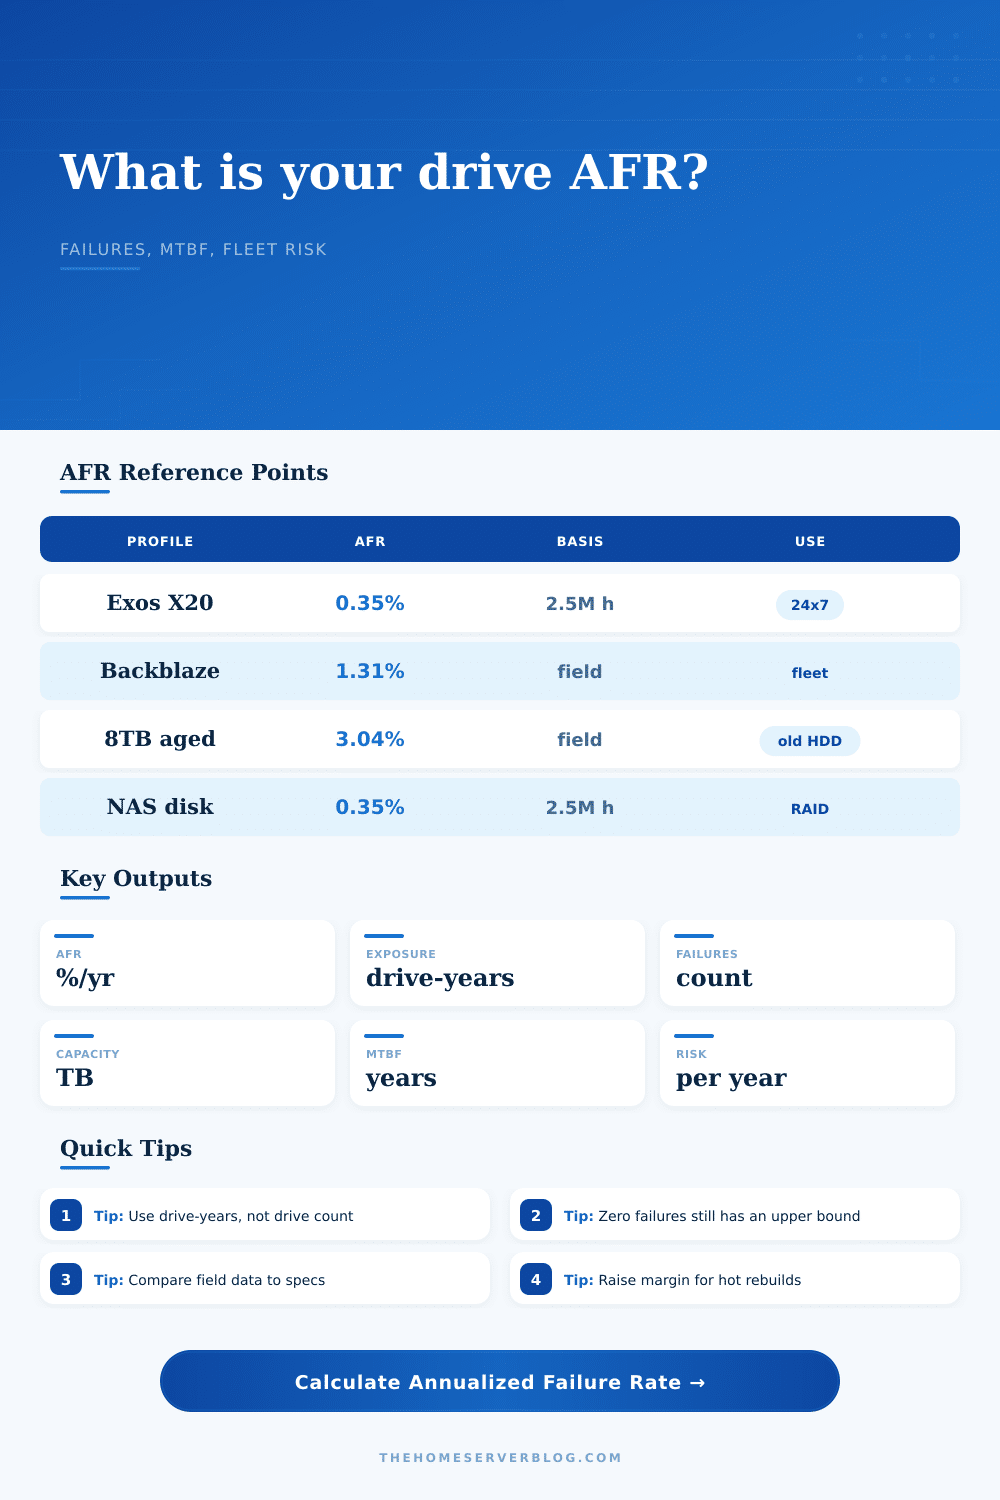
What you’ll notice looking at the reference points above is we’re talking about a range of 0.01 (enterprise-grade disks) to 3% (older field drives). That’s a huge range. What are those numbers good for? They are sanity checks. If you find yourself coming up with a yearly failure rate greater than what the industry standard is for your type of disk drive, then there’s something wrong either with your hardware or your environment.
Don’t strive for perfection. Just strive for predictable decay.
All of this boils down to risk management. Calculations won’t prevent a drive from failing tomorrow. That’s entropy. However, understanding your fleet risk enables you to keep spares on hand, plan for rebuilds in off-peak times, and test backup systems long before they’re needed. Suddenly a possible disaster turns into a maintenance ticket. This isn’t about eliminating failure. It’s about preparing for failure, in such a way that it only becomes an inconvenience.
The moddern drives are complex.