Bandwidth Delay Buffer Calculator
Size bandwidth-delay product, TCP receive windows, and practical buffer headroom for home servers, WAN backups, VPNs, Wi-Fi links, and lab fabrics.
Full Breakdown
| Link Scenario | Bandwidth | RTT | Raw BDP | 10% Buffer Target |
|---|---|---|---|---|
| Home fiber to regional cloud | 1 Gbps | 20 ms | 2.38 MiB | 2.62 MiB |
| 2.5G NAS across one switch | 2.5 Gbps | 1 ms | 0.30 MiB | 0.33 MiB |
| 10G rack-to-rack replication | 10 Gbps | 0.5 ms | 0.60 MiB | 0.66 MiB |
| Off-site backup tunnel | 1 Gbps | 95 ms | 11.32 MiB | 12.45 MiB |
| 40G lab fabric hop | 40 Gbps | 0.2 ms | 0.95 MiB | 1.05 MiB |
| Reference Item | Value | Why It Matters | Home Lab Note |
|---|---|---|---|
| Classic TCP window | 65,535 bytes | Too small for fast WANs without scaling | Expect scaling above modest RTTs |
| Window scale option | RFC 7323 | Allows large receive windows | Check OS autotuning settings |
| Ethernet payload estimate | 1,460 bytes | Approximate TCP MSS over 1500 MTU | Useful for packet counts |
| Jumbo payload estimate | 8,960 bytes | Approximate TCP MSS over 9000 MTU | Only use end-to-end jumbo |
| Bufferbloat risk | High queue | Excess buffers add latency under load | Use SQM for internet edges |
| Equipment Profile | Planning Buffer | Typical Role | Best Fit |
|---|---|---|---|
| Integrated home router | 32 MiB shared | Basic NAT and Wi-Fi gateway | Sub-gigabit to gigabit WAN |
| Smart access switch | 12 MiB shared | Client edge switching | Short LAN paths |
| NAS or storage server NIC | 128 MiB host | SMB, NFS, replication | Multi-flow storage traffic |
| Mini PC firewall/router | 512 MiB host | Routing, VPN, shaping | Fast WAN and VPN tunnels |
| Enterprise switch fabric | 2 GiB shared | Aggregation and lab core | 10G to 40G fabric testing |
| Project | Starting Link | Latency Range | Calculated Focus | Practical Target |
|---|---|---|---|---|
| Family photo NAS sync | 1 to 2.5 Gbps | 1 to 5 ms | Small BDP, many files | Host buffers and disk queue |
| Remote Proxmox backup | 300 Mbps to 1 Gbps | 40 to 110 ms | WAN BDP and VPN overhead | TCP window autotuning |
| Homelab 10G storage VLAN | 10 Gbps | 0.2 to 1 ms | Packet bursts and jumbo MTU | Switch fabric consistency |
| Wi-Fi 6 client cluster | 600 Mbps to 1.2 Gbps | 8 to 25 ms | Airtime efficiency loss | AP placement and channel plan |
| Multi-site media transfer | 1 to 10 Gbps | 20 to 150 ms | Large windows and flows | Parallel streams plus monitoring |
So why does copying files feel slow? Are you wondering if your NAS is just slow or if your cable are broken? Most of the time it’s not your hardware per se.
Your devices will expects a certain amount of data going through pipe all at one time. If there isn’t enough data going into the pipe to meet this amount, you get an invisible bottleneck called the bandwidth delay product. It trips up even the most expensive gear. It’s really just physics.
Why Your File Copying Is Slow
Imagine your network connection as a pipe. Its width is its bandwidth and how long it takes a drop of water to go from one end to the other is its latency. When you open up the faucet, the water doesn’t magically materialize in the drain. First it fills up the pipe. How much water is in the pipe? That’s the bandwidth delay product. If you stop feeding the computer before it can fill the pipe then it sits there, waiting for an acknowledgment that hasn’t come yet. You’re paying for a highway that your car refuses to fill.
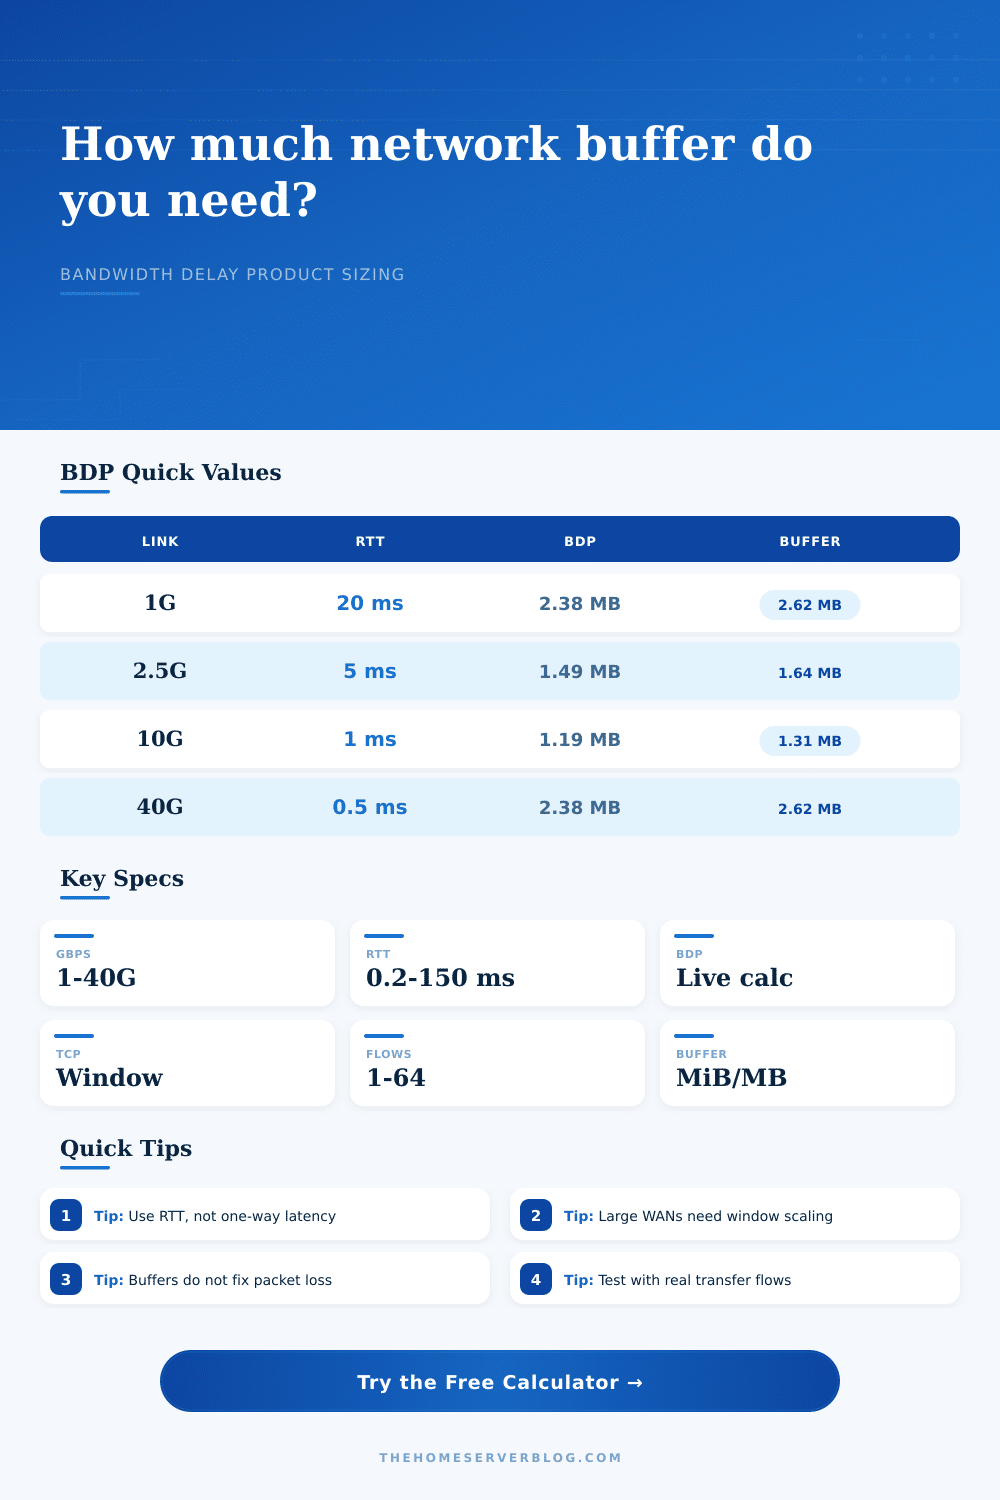
After plugging in your round trip time and your link speed, the calculator does the rest. No need for you to guess at the coefficients. It converts those raw numbers into real buffer size. For example, it may recommend 2.62 megabytes if your link has a latency of 20 milliseconds and a gigabit connection. That figure is how many bytes of data need to be in flight so that the link stays saturated. It is not how much RAM you think your router should of have. It’s a measure of how much data are flowing from one device to another over the link in question right now.
Home routers don’t pay attention to this fact. Most home routers is configured with very small buffers that are intended for website browsing, not big file transfers. When you attempt to transfer big files, their queues fill up and packets gets dropped. TCP slows down, retries, etc. That’s bufferbloat. Your fast Internet connection becomes a frustrating one.
The tool allows you to determine if your existing configuration has sufficient headroom to accommodate that traffic without choking it. It also factors in parallel flows, because today’s backup and sync apps splits their transfer across several channels. Each flow should have its own part of the data being transferred. If there are four active flows, each one require some slice of that.
But there’s a catch: increasing the buffer also masks latency problems. You may feel like your network is slow even though it actualy isn’t. We don’t want to max everything out. We just want to find the sweet spot of enough so that we have a full pipe but not so much that we introduce unneccesary delays.
That’s why they have a reference table on the page that shows the amounts for different scenarios. For example you might only need a few hundred kilobytes for a local NAS sync. You might need more than ten megabytes for a remote backup tunnel. Why? Because the distance matter, not necessarily because the speed does.
This has implications regarding your operating system too. The OS can tune its own TCP windows dynamically but with limitations. If the calculated BDP exceeds the OS window size, Windows and Linux won’t be able to use all your available bandwidth. In other words, if your calculation of BDP is bigger than the OS window size, it will not be able to use all of the available bandwidth. This is where maybe tuning your socket settings on your server by giving it larger receive windows comes into play. A little tweak makes a huge diffrence in throughput.
Stop guessing when your transfers are slow. Measure the latency. Calculate the product. Size your buffers accordingly. When your pipe fills up, everything looks right again. Then you can get back to work.