Database schema capacity planning
Denormalization Storage Calculator
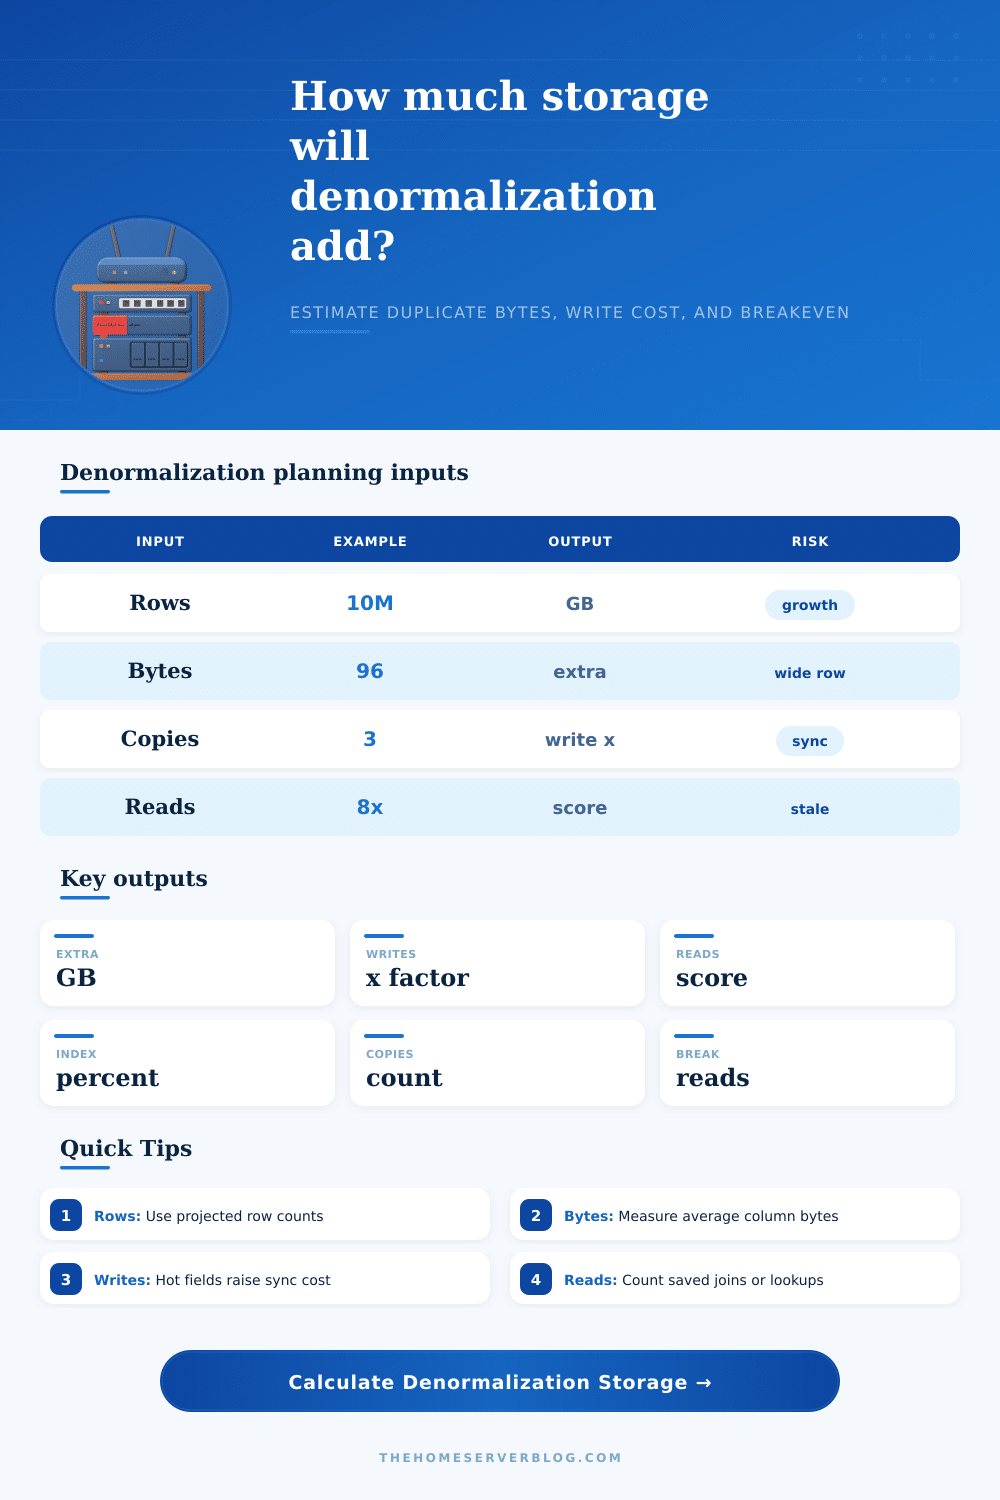
Estimate how many extra bytes a denormalized schema adds, how much write work it creates, how much read work it saves, and the query volume needed to justify the duplicated data.
Storage breakdown
Workload breakdown
Small copied attributes such as names, status labels, slugs, and counters are usually easy to maintain.
Several read models or covering indexes can be fine when source fields update slowly.
Feeds, dashboards, and search documents often justify duplication when they avoid repeated joins.
Indexes on duplicated fields can rival the table bytes, especially for UUIDs, JSON paths, and text keys.
| Schema preset | Typical duplicated data | Read benefit | Write risk | Best refresh pattern |
|---|---|---|---|---|
| Order Summary | Customer name, address zone, payment state, line totals | Fewer order detail joins | Moderate status churn | Transactional update plus audit check |
| Activity Feed | Actor display name, avatar URL, object title, visibility | Fast feed rendering | Profile updates fan out | Async queue with repair job |
| Product Catalog | Brand, category path, inventory flag, rating summary | Fast listing filters | Inventory and price churn | CDC into search/read model |
| Analytics Rollup | Day, tenant, metric totals, dimensions | Dashboard scans shrink | Late-arriving facts | Incremental aggregate refresh |
| User Profile Cache | Name, role, plan, permissions, locale | Lower auth lookup cost | Permission staleness | Cache version or expiry |
| Search Document | Flattened text, facets, rank signals, tags | Search avoids relational joins | Large document rewrites | Event-driven reindex |
Normalized design
- Stores each fact in one primary place.
- Usually has lower storage and simpler writes.
- Can require joins, lookups, and random reads.
- Best for hot mutable attributes and strong consistency.
Selective denormalization
- Copies a few stable fields into read-heavy rows.
- Balances storage growth against query savings.
- Needs refresh rules and stale-data monitoring.
- Best for names, labels, counters, and snapshots.
Materialized read model
- Builds a separate table, index, document, or cache.
- Often gives the biggest read latency improvement.
- Creates more storage and operational repair paths.
- Best for feeds, search, analytics, and dashboards.
| Factor | Low assumption | Planning default | High assumption | What it changes |
|---|---|---|---|---|
| Row/page overhead | 8% | 18% | 45% | Tuple header, fillfactor, alignment, page splits, MVCC slack |
| Index overhead | 10% | 35% | 120% | Secondary indexes, covering indexes, JSON path indexes, sort keys |
| Compression saving | 10% | 40% | 75% | Repeated labels compress well; UUIDs and hashes compress poorly |
| Update frequency | 1% rows/day | 5% rows/day | 80% rows/day | Refresh jobs, WAL volume, replicas, stale-data repair queue |
| Materialized copies | 0 | 1 | 4+ | Read models, cache tables, data marts, search indexes, CDC sinks |
The conversation starts with a nice design that’s well-normalized to 3rd normal form. Your joins makes sense; your data is consistant; your database appear tidy. Production traffic shows up and suddenly those joins becomes an expensive bottleneck rather than a good query.
Let’s talk about denormalization. Whether it’s a technical debt nightmare or a brilliant optimization are a popular debate topic. This calculator helps you move past the debate and turn some of your fear (which is subjectively scary) into something quantifiable in terms of storage and performance. Before writing a single line of migration SQL, you’ll know exactly what you’re gaining in terms of speed vs what you’re giving up in terms of added storage.
How to Decide if Denormalization is Worth It
In short, denormalizing is a way of trading space for time. You’re copying data so that you don’t have to do an expensive lookup, but each byte you copy incurs a cost. That cost manifests as slower writes, higher storage bills, and the headache of having to keep all those copies in sync. It’s largely a matter of knowing what you’re really measuring.
Tweaking the number of columns copied or how many rows the average will be is just adjusting the physical weight of your shortcut. Maybe it’s just a few stable text field in a user profile cache. Or maybe it’s embedded avatars, titles, and visibility flags on every single record in your activity feed. Both may feel like simple duplication task, but their storage impact can be huge.
The overlooked piece here is write amplification. When you update some source field once but have three denormalized tables waiting for that change, your database engine must performs four writes instead of one. And if you’re data hot? It multiplies fast. Here, the tool ask questions about how many materialized copies there are, and how often they get updated. Copying a bunch of stuff that changes often can make what seemed like a storage optimization turn out to be a write-heavy liability. Your reads may have been a millisecond faster, but you might lose seconds running maintenance scripts overnight to reconcile stale data. That trade-off should of been visible before you decide to commit to the schema change.
Of course, reading the outputs requires looking beyond the raw gigabyte count; you have to see what’s actualy being measured. What I find most helpful here is the breakeven value, the number of queries that need to benefit from this change to offset the cost of doing so. If your breakeven is fifty thousand reads per day but you only serve ten thousand, you’re paying money and complexity for nothing. If you beat the breakeven number in terms of daily traffic volume, though, then the performance boost are paying for itself. That’s why this metric makes you check the business case against real-world usage patterns instead of some theoretical peak load.
Surprisingly, it also takes into account the index overhead of the data. If you have columns with values that require querying, then you probably add an index. Developers tend to overlook this and each column adds overhead. Because of duplicated fields, some secondary indexes can match size of the actual table. For example, JSON path indexes or other text keys is updated every time one row changes, so the index size can be comparable (and even exceed) the table itself. When ignored, this “hidden” cost results in schema designs that appear lean on paper but grow out of control when fully indexed.
And speaking of compression, that’s another factor I didn’t expect to be so important. Duplicates like repeated category names and status labels compress very well. This reduces their size massively. Random hashes and UUIDs don’t. You can tune compression savings based off what your storage engine can achieve. And this has an impact, swinging the decision from “denormalize and fit in memory” to “oh my god there’s no way we’ll get away with that”. It is a small detail, but a significant one if you are designing for scale.
We want to duplicate only when it makes sense, so what’s the solution? Should you not normalize at all? No. Should we normalize everything? That is also not it. Instead, treat mutable data as costly and stable fields as inexpensive. Run them through this estimator, stop guessing, and begin intentionally engineering your database. You’ll wind up with a schema that finds the right tradeoff between performance and consistency, instead of leaning too far in either direction because you’ve guessed wrong. Your gut feelings might mislead you, but not the math.