End-to-End Delay Calculator
Combine propagation, serialization, processing, queuing, retransmission, hop count, packet size, link speed, and jitter margin into one practical path delay estimate.
1Named path presets
2Path and packet inputs
3Delay component grid
4Breakdown
5Reference tables
Medium velocity and path behavior
| Medium | Velocity factor | Typical use | Delay clue |
|---|---|---|---|
| Fiber | 0.67 c | Metro, ISP, WAN | About 5 us/km |
| Cat6 | 0.65 c | Patch, rack, home LAN | Very short paths |
| Coax | 0.85 c | DOCSIS plant | Access delay matters |
| Wi-Fi | 1.00 c | Home and mesh radio | MAC retries matter |
| LTE or 5G | 1.00 c | Backup WAN | Scheduler adds delay |
| LEO satellite | 1.00 c | Rural or mobile WAN | Radio path plus gateway |
Serialization examples
| Frame | 10 Mb/s | 100 Mb/s | 1 Gb/s |
|---|---|---|---|
| 64 B | 0.051 ms | 0.005 ms | 0.001 ms |
| 512 B | 0.410 ms | 0.041 ms | 0.004 ms |
| 1500 B | 1.200 ms | 0.120 ms | 0.012 ms |
| 9000 B | 7.200 ms | 0.720 ms | 0.072 ms |
Delay class by workload
| Workload | Comfortable | Watch | Painful |
|---|---|---|---|
| Gaming or control | <20 ms | 20-50 ms | >50 ms |
| Interactive shell | <40 ms | 40-120 ms | >120 ms |
| Voice or video | <80 ms | 80-150 ms | >150 ms |
| Replication | <15 ms | 15-60 ms | >60 ms |
| Bulk transfer | <100 ms | 100-250 ms | >250 ms |
Common home lab path sizes
| Path | Hops | Main risk | Practical target |
|---|---|---|---|
| Switch to NAS | 1-2 | Packet size | Under 1 ms |
| PC to firewall | 2-4 | Queueing | Under 3 ms |
| Home to ISP DNS | 5-9 | Access link | Under 20 ms |
| Home to cloud API | 8-16 | Route length | Under 60 ms |
| VPN to office | 10-22 | Tunnel + queue | Under 100 ms |
Every time you enter a command at a terminal, you watch the blinking cursor waiting for it to respond. That delay isnt just a matter of distance. Every delay multiplies to become another tax on speed, and every one have its own tax rate. People usually assume there’s only one delay: distance from server. They think in kilometers or miles. But it’s way more detailed than that, and frequently counterintuitive.
The delay you experience are compounded by network congestion, software decisions, hardware limits, and even physics. Understanding which part of that total delay affect your specific path is the difference between being efficient and being frustrated.
Why Your Internet Is Slow
That’s just the propagation delay, or the time it takes for that light to move through whatever medium it moves through. Fiber optics slow light down to about two-thirds the speed of light in a vacuum. Fiber optics slow light down to about two-thirds the speed of light in a vacuum, while copper cable are slightly slower. And that sets the absolute floor. You can’t engineer it away. The signal has to take at least twenty-five milliseconds to get from point A to point B. That is only if everything on both ends have infinite bandwidth, zero processing overhead, and a route that is three thousand miles long.
That’s where people goes wrong. When they see their internet isnt up to snuff, they think it’s because the internet sucks, but really they’re running into speed of light. In today’s networks, however, propagation isnt typically the problem, it’s serialization. That’s the time required to push bits onto the wire, which depends entirely on your connection’s bandwidth and your packet size: Big packets is slower to serialize when there’s congestion on an uplink, so they pile up in a pipeline effect waiting their turn to go out. Plugging those numbers into the calculator above give you the answer without having to guess between serialization (fixable by breaking things down) vs. Propagation can be fixed by getting closer to the server.
There’s also the unseen factor of node processing time: every hop requires a switch, router, firewall and so on to read the packet’s header, compare against tables, determine which direction to route it in. It happens in microseconds, but when you’re multiplying it by twenty hops over some complicated global route, even a tiny cost start to add up. If you’re using encrypted tunnels or passing through deep packet inspection systems, that per-hop cost go way up. You wont find them marked on any map, but they’ll be there, each adding their own little fee onto your overall delay.
And then there’s queuing. That’s where theory meets real life. Packets sits in buffers when the links are saturated. It’s often referred to as bufferbloat, because big queues hide latency, making a fast link into a slow one. Even on a low-use path, there may be no queueing; at peak hour it can double your delay. You can model that variance using the tool, so instead of getting an optimistic view of best case, you’ll get a realistic expectation of the worst-case.
There’s yet more uncertainty because retransmission adds another source of delay. Packets gets dropped by wireless links and over-subscribed network paths. TCP senses a lost packet and backs off while waiting for an acknowledgement to resend it. This adds brief bursts of delay that make it seem as though the link has frozen. That’s why real-time control and gaming can be choppy despite having high average bandwidth. The jitter margin in the model captures this variation, letting you know not only the average delay but also the range of experiences your users will encounter.
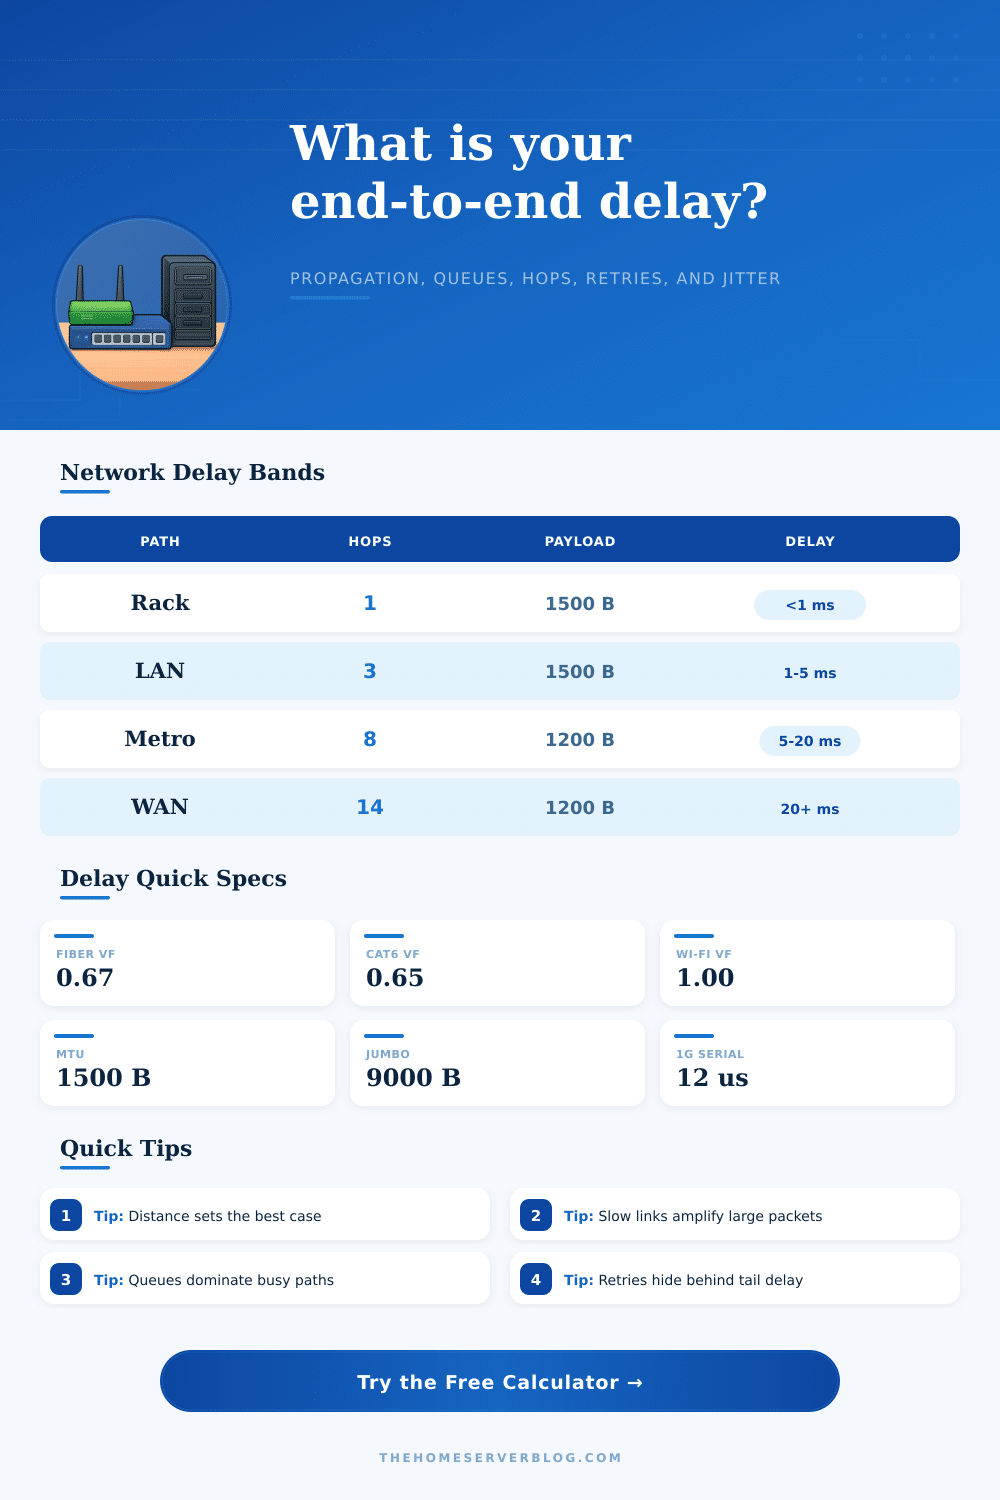
A quick reference table on the page provides expected latencies for various use cases. For example, rack-to-rack should be less than a millisecond, while metro fiber paths will be more like twenty. Use these as a reference point for what you’re seeing. Anything below one hundred milliseconds is fine but hovering at fifty means you’re getting into watch territory. Your experience will degrade noticeable if it gets over a hundred.
At the end of the day, this is an engineering vs. Physics game of end-to-end delay. Distance is up to you (i.e., pick nearer servers). Serialization is reduced via packet size/smaller or link speed/faster. Queuing is managed by improving traffic shaping. However, you dont get all three simultaneous. Your goal isnt zero latency, because there’s none. Rather, it’s acceptable latency for your particular workload. When you break the total into parts, you stop guessing where the slowness is and instead precisely target it. What used to be a mysterious pause at your cursor is now a map that shows you exactly what to fix.