IPv4 Exhaustion Date Calculator
Estimate when a remaining IPv4 pool reaches its reserve floor using daily allocation burn, reclamation, growth, and policy overhead.
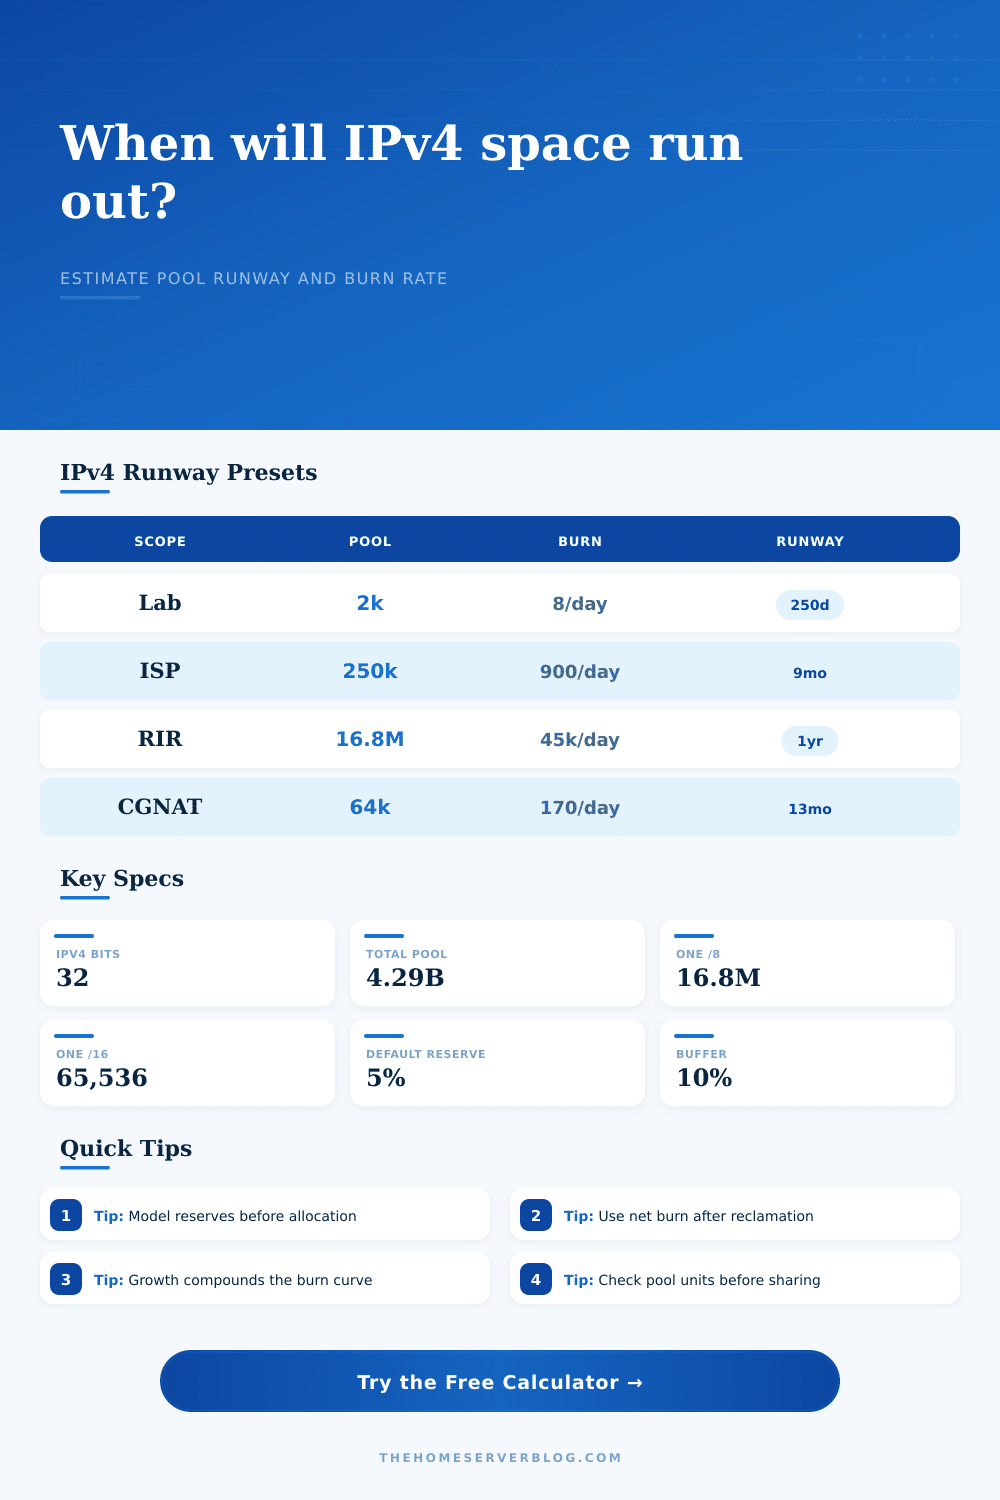
The grid summarizes the active model like an IPAM capacity dashboard: pool size, prefix scale, current burn, and calendar runway.
| Prefix | Addresses | Typical planning use | Exhaustion sensitivity |
|---|---|---|---|
| /24 | 256 | Small routed customer block, lab VLAN, peering LAN slice | Short runway if assigned daily |
| /22 | 1,024 | Campus edge pool, small hosting subnet group, CGNAT shard | Watch fragmentation closely |
| /20 | 4,096 | Regional broadband pool, medium VPS stock, enterprise reserve | Good weekly planning unit |
| /16 | 65,536 | Large provider allocation, cloud region, national access pool | Growth rate dominates outcome |
| /8 | 16,777,216 | Registry-scale historical block or final allocation reference | Policy limits often matter more than raw count |
| Source / equipment | Best input pulled from it | Useful spec | Planning caution |
|---|---|---|---|
| IPAM platform | Free addresses and allocated prefixes | Prefix status, owner, VRF, utilization | Exclude reserved and quarantine ranges |
| DHCP lease system | Consumer or access-network demand | Active leases, pool high-water mark | Lease churn is not the same as allocation burn |
| CGNAT appliance | Shared public pool pressure | Subscribers per public IP, port blocks | Port exhaustion can arrive before address exhaustion |
| BGP / routing table | Advertised prefix inventory | Route count, aggregate size, more-specifics | Advertisements may include unusable or policy-held space |
| RIR delegated file | Allocation history and registry status | Date, registry, resource count, status | Delegated does not guarantee currently usable |
| Policy pattern | Common reserve floor | Burn rate driver | Modeling note |
|---|---|---|---|
| Final /8 style allocation | 10% to 20% | One-time requests under strict max-size rules | Use policy overhead because requests are chunky |
| ISP dynamic customer pool | 5% to 15% | Subscriber growth and churn | Use net burn after reclamation, not gross signups |
| Hosting provider pool | 5% to 10% | VPS creation, dedicated servers, floating IPs | Fragmentation overhead can be material |
| Enterprise migration reserve | 10% to 20% | New sites, NAT exceptions, vendor allowlists | Negative growth can model IPv6 or cleanup progress |
| IXP or peering LAN | 15% to 20% | Member growth and route-server assignments | Small pools fail fast if assignment size is fixed |
| Project scenario | Starting pool | Net burn | Review cadence |
|---|---|---|---|
| Home lab public-services pool | /24 to /23 | 1 to 10 addresses per day during buildout | Weekly while provisioning |
| Small ISP customer edge | /19 to /17 | 100 to 1,000 addresses per day | Weekly or twice monthly |
| Hosting provider region | /18 to /15 | 500 to 8,000 addresses per day | Weekly for launch windows |
| CGNAT public pool reserve | /20 to /14 | Driven by subscribers per public address | Daily during subscriber migration |
| Registry-scale policy pool | /12 to /8 equivalent | Batchy requests with policy caps | Monthly plus policy review |
But here’s the thing: you don’t run out of IPv4 addresses, you run out of a way to get enough continuous addresses to satisfy what you need today. And why does it matter? We are not all hitting the end of line at once. Running out isn’t an event; it’s a local issue and it come in waves. How fast each wave hits you depend on how you cut up your remaining inventory. That’s the bit the calculation do for you (above), but that’s where doing the planning comes into play.
You need to know what goes into that input. The problem with most people’s left-over IPv4 pool is that they consider it a bank account. They have X, they use some, now they has fewer. Engineering networks are much more than numbers. The struggle around how many addresses is usable and how they are allocated matter.
How to Plan Your IP Address Use
Carving a /24 out for a new customer doesn’t just remove 256 addresses from your pool; it removes a contiguous block. Your pool might have enough physical address left over to handle ten more customers. But it might only have room to accommodate one of them somewhere within its fragments. Overhead include the unusable fragments, such as policy-held ranges and the slack for route aggregation. It uses these fragments when calculating size of your pool. Not accounting for the overhead is the quickest path to painting an overly rosy picture, and when you attempt to allocate an IP, that picture shatters.
Finally there’s growth. Growth isn’t a straight line either; it’s not just consumption. When you assume a constant burn rate, you’re assuming you’ll continue to burn through addresses at a constant rate over time. But the network grow exponentially. Each new customer or service create more demand for address space, which in turn typically demands more infrastructure. That infrastructure has its own set of addresses which need to be allocated. Redundant links, monitoring agents, management interfaces… They all consumes from the pool. That growth rate represent this compounding demand.
Because the curve gets steeper as you grow, a few percent points higher in your growth rate can remove months from your runway. Negative growth rates reflect two factors: One is active IPv6 migration. But the other is address reclamation. How fast are you removing older addresses? If you have an aggressive cleanup program, you’ll see a reduction in amount burned, and thus a negative growth rate.
Most people forget about this one. They calculate their gross rate of address allocation; however, they fail to include rate of recovery. This is why net burn is so important. The reserves are just as important: you don’t want to run dry either. You want to end up at a comfortabley floor that leaves you enough room to make emergency patches. And you’d like some buffer to test your migrations or handle vendor exception. If you put a reserve floor at 5% or 10%, that shifts your exhaustion date dramaticly.
That begins making you consider conservative addressing. You’ll talk about buying from the market sooner then if you’re thinking about depleting absolutely everything. This table of references on page shows what happens to various pool sizes when they get different levels of buffer. Even if you’re burning low, a small /20 pool is going to exhaust quickly. But a big /8 may well last years… Though often it’s the policy constraints that overwhelms the total number.
Management of IPv4 is a logistics issue more than a mathematics issue. You’re shipping product in a limited space. Visualization is tool. And the strategy is what you do with the visualization.
Is this a six year timeline or a six month timeline? That’s where your policy becomes tight. That’s where you start acquiring addresses on the open market. What you don’t want to do is run out. You would of wanted to run out when you want to run out. And you want to give yourself some time to prepare for next part of building your network.