Memory Latency Calculator
Estimate effective memory access delay across CPU cache, DDR timing, TLB misses, ECC, NUMA hops, virtualization overhead, and workload access patterns for home servers and lab hosts.
⚙Memory Path Presets
🧠Latency Inputs
This calculator separates raw DRAM timing from effective memory latency. Cache hit mix, TLB misses, page faults, NUMA placement, ECC buffering, and contention can outweigh the CL number in real home server workloads.
Calculation Breakdown
🖥Memory Path Spec Grid
📊Typical Memory Path Latency Ranges
| Memory path | Typical range | What changes it | Home server note |
|---|---|---|---|
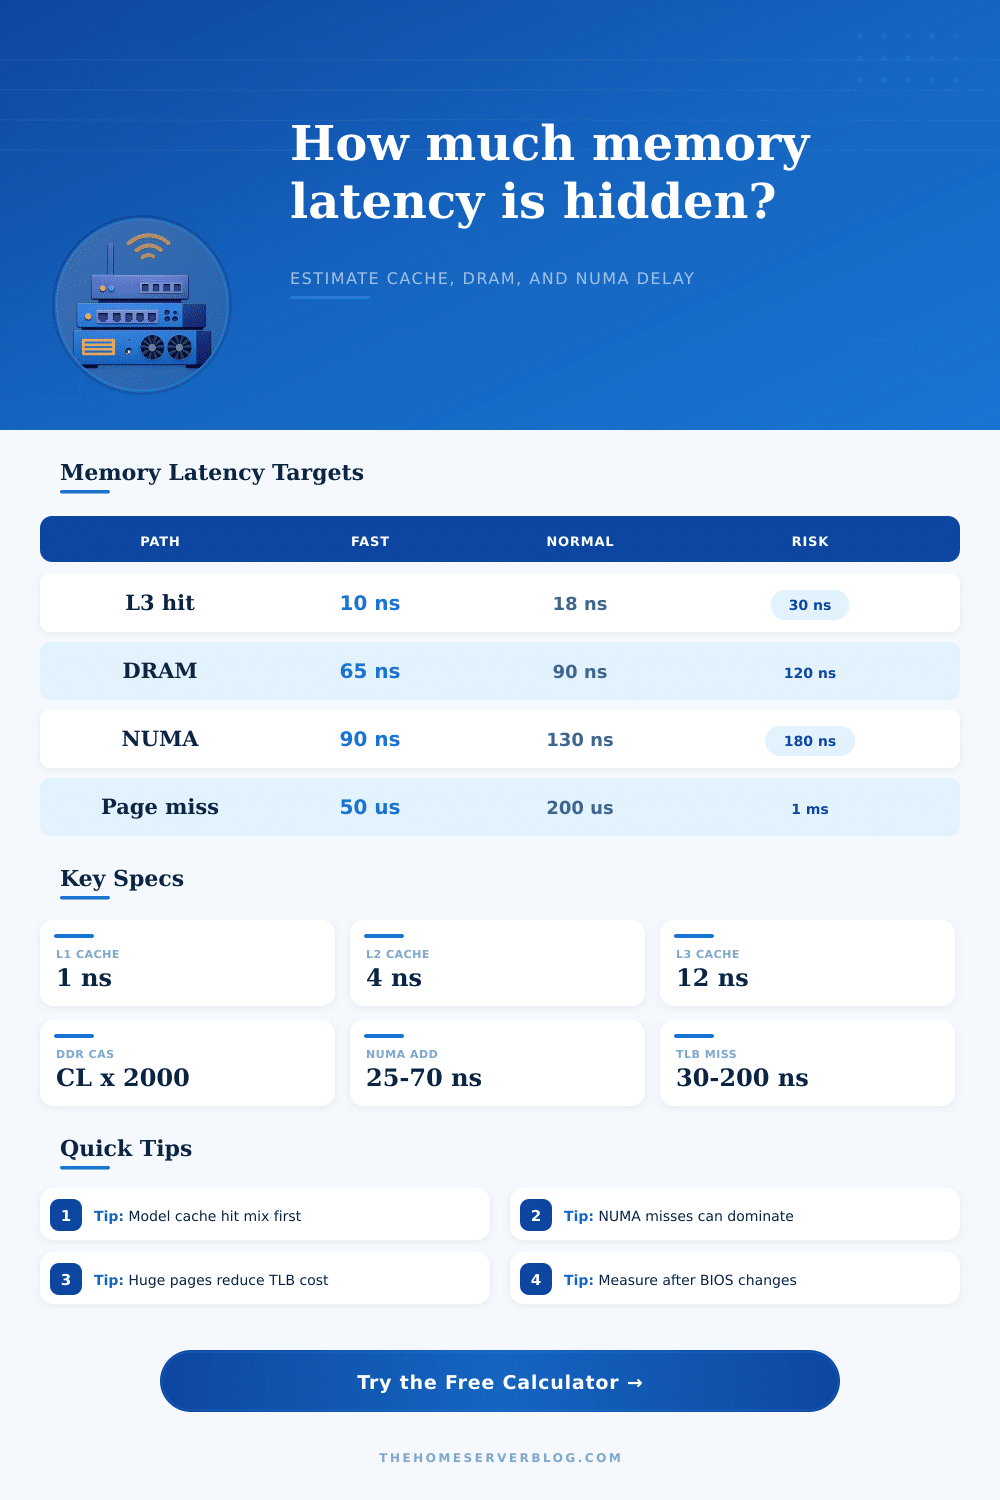
| L1 data cache hit | 0.7 to 1.5 ns | CPU clock and pipeline | Usually invisible unless the working set fits extremely well |
| L2 cache hit | 3 to 6 ns | Core design and clock | Important for game servers, routing, and small hot loops |
| Shared L3 cache hit | 10 to 25 ns | Chiplet layout and core distance | Can change between CPU families even with the same memory kit |
| Local DRAM first word | 55 to 110 ns | DDR rate, CL, tRCD, tRP | Use CAS nanoseconds as only one part of the full memory path |
| Remote NUMA DRAM | 90 to 190 ns | Socket hop and interconnect load | Pin VMs and memory when latency-sensitive services span sockets |
| Major page fault | 50 us to 5 ms | Storage, swap, and pressure | A tiny rate can distort averages and destroy tail latency |
💾Configuration Effects
| Configuration | Latency effect | Bandwidth effect | Practical action |
|---|---|---|---|
| Single channel mini PC | Similar first word | Lower total width | Fine for routing, light containers, and small media services |
| Dual channel desktop board | Good training margin | Balanced throughput | Often the best home lab latency and simplicity balance |
| Four DIMMs on DDR5 | May need slower MT/s | Capacity rises more than speed | Prefer stability for VM density and ZFS ARC capacity |
| Registered ECC server | Small buffer delay | Many channels help | Reliability and capacity usually beat a few nanoseconds |
| Dual socket host | NUMA can dominate | Large aggregate width | Keep latency-sensitive guests close to their memory node |
| Huge page VM host | Fewer TLB penalties | No direct bandwidth gain | Useful for databases, hypervisors, and large memory guests |
🧮Workload Sensitivity Reference
| Workload | Latency sensitivity | Tail risk | Optimize first |
|---|---|---|---|
| ZFS ARC and metadata | Medium | Medium | Memory capacity, ECC, and cache hit rate before tight timings |
| Database random reads | High | High | Cache hit rate, huge pages, NUMA locality, and storage pressure |
| Virtual machine host | Medium | High | Reduce swapping, pin noisy VMs, and size memory headroom |
| Game server tick loop | High | Medium | Low cache misses, stable clocks, and local memory placement |
| Media server | Low | Low | Storage and encoder throughput before memory tuning |
| Router or firewall | Medium | Medium | Packet path locality, NIC queues, and CPU interrupt placement |
📈Common Project Sizes
| Project | Memory pattern | Primary risk | Useful calculator setting |
|---|---|---|---|
| 2-bay home NAS | Warm ARC, light metadata | Too little RAM for cache | High L3 and DRAM locality, low page fault rate |
| 64 GB Proxmox node | Mixed guest memory | TLB and ballooning overhead | VM layer, moderate huge pages, daily safety buffer |
| Database lab box | Random access working set | Cache misses and page faults | Database profile with higher TLB and tail sensitivity |
| Game server host | Hot loop plus player state | Tick spikes | High cache hit rates and low contention |
| Dual socket rack server | Large VM and storage pools | Remote NUMA access | Reduce local DRAM share and add NUMA penalty |
| Kubernetes mini cluster | Many small services | Noisy neighbor contention | Container layer, moderate contention, low page fault rate |
💡Memory Latency Planning Tips
Memory latency refer to the amount of time that it takes for a processor to access data from memory. This can become a significant factor in systems that is performing specific workloads. In some cases, the system may appear slow due to memory latency, despite having enough memory to perform the required task.
Memory latency is often the result of how the processor reach the memory. Therefore, understanding the different components of memory latency will allow for the efficient management of the system. The calculator available on this page allow you to model memory latency for your system.
Memory Latency and How to Measure It
It takes into account various factor that will impact the memory latency of your system. These factors include cache hit rate, DRAM timings, NUMA distance, and TLB pressure. Each of these factors will contribute to the total latency of the memory in your system.
Using this calculator will allow you to understand how much time are spent on different components of the memory latency. Cache hit rates play a significant role in memory latency. High hit rates for level 1 (L1) cache mean that the processor will spend the bulk of its time accessing memory in the fastest part of the memory.
Low hit rates for L1 cache will force the processor to access level 2 (L2) cache and level 3 (L3) cache, which are faster than dynamic random access memory (DRAM). However, accessing DRAM will take more time then access L2 or L3 cache. Using these inputs will allow the calculator to model the rate at which the processor will find the information it needs within the memory rather than having to access the slower DRAM.
DRAM timings are one of the most common focus of system optimization. However, it is only one part of the total memory latency. Each of the DRAM timings will impact the amount of time it takes for the first word of data to be deliver to the processor.
This value will be displayed in nanoseconds in the memory latency calculator to allow you to compare it with the memory cache latency and the NUMA latency. Improving any of the other components of memory latency will provide more benefit to your system than improving the DRAM timings. Memory latency will increase if the data that a processor need to access is located on a different memory controller than the processor’s socket.
It is called non-uniform memory access (NUMA) latency. The further the memory controller and the processor are from one another, the higher the latency. Using the local DRAM share input will allow you to model how much of your systems memory is accessed local from the processor rather than from a remote memory controller.
The percentage that you enter will determine how much the remote access to memory will impact the overall memory latency of the system. TLB misses and page faults will