MySQL Max Connections Calculator
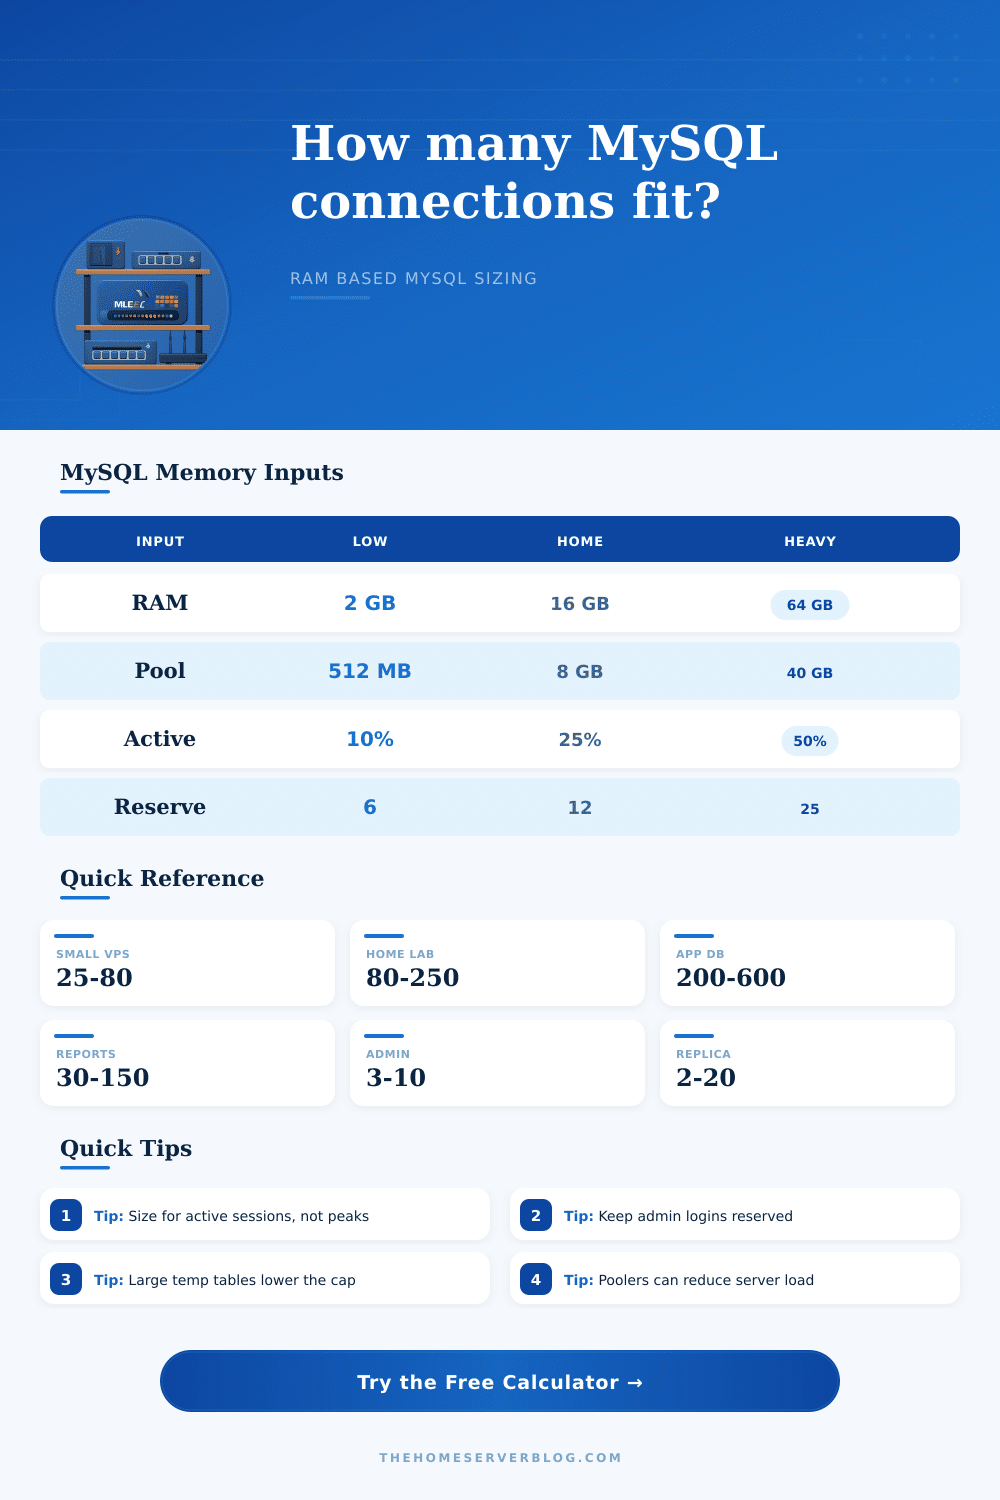
Estimate a safer max_connections value from server RAM, InnoDB buffer pool size, per-session buffers, active connection rate, and reserved admin or replication slots.
| Workload class | Typical active percent | Memory behavior | Connection sizing note |
|---|---|---|---|
| Web app OLTP | 10% to 30% | Short queries, mostly idle pool sessions | Good fit for weighted sizing plus strict app pool limits |
| CMS blog or forum | 15% to 35% | Bursty reads, writes, and plugin queries | Keep spare admin slots for cache stampede recovery |
| Home automation recorder | 5% to 20% | Frequent small inserts and dashboard reads | Usually low caps work well with persistent app pools |
| Reporting replica | 25% to 60% | Large sorts, scans, and memory temp tables | Prefer lower caps and query queues for predictable RAM use |
| ETL or batch import | 40% to 80% | Write-heavy transactions and binlog cache pressure | Limit workers intentionally instead of raising max_connections |
| Per-session variable | Common starting value | Allocated when | Why it changes the cap |
|---|---|---|---|
| thread_stack | 256 KB to 512 KB | Connection thread exists | Always part of the idle connection floor |
| sort_buffer_size | 256 KB to 4 MB | Sort operation | Large global increases multiply across active sort queries |
| join_buffer_size | 256 KB to 2 MB | Non-index join path | Bad indexing can turn many sessions into heavy sessions |
| tmp_table_size | 16 MB to 128 MB | Internal memory temp table | The biggest practical limiter for report-style workloads |
| binlog_cache_size | 32 KB to 1 MB | Transactional writes with binary log | Write-heavy workloads need extra active memory allowance |
| Server RAM | Example buffer pool | OS reserve | Practical connection posture |
|---|---|---|---|
| 1 GB to 2 GB | 256 MB to 768 MB | 256 MB to 512 MB | Use small app pools; avoid large temp table settings |
| 4 GB to 8 GB | 1 GB to 4 GB | 1 GB to 1.5 GB | Enough for modest web apps with controlled concurrency |
| 16 GB to 32 GB | 8 GB to 20 GB | 2 GB to 4 GB | Home lab and small production workloads can reserve more slots |
| 64 GB to 128 GB | 40 GB to 90 GB | 6 GB to 12 GB | High caps are possible, but app pooling still protects latency |
| Scenario | Connection pattern | Reserve target | Operational note |
|---|---|---|---|
| Single WordPress site | PHP-FPM pool driven bursts | 5 to 10 slots | Align PHP workers below the calculated safe cap |
| Nextcloud home server | Sync clients plus web UI | 8 to 12 slots | Background jobs can overlap with user requests |
| Proxmox service VM | Several apps sharing one database | 10 to 20 slots | Budget per app pool, then leave global admin headroom |
| Read replica analytics | Few clients, heavy queries | 10 to 25 slots | Lower max_connections can prevent swap during large reports |
tmp_table_size, lower the connection cap or isolate those jobs on a replica with its own sizing model.I know you’re panicking because your database is refusing to accept any more connections. No, not now: 2 a.m. It is a Saturday night when traffic peaks and now all of your users are getting timeout errors as you frantically hunt down whatever’s chewing up memory. Why? Because it was never a burst of users, it’s almost always some kind of setting or configuration that appeared acceptable on paper, but overlooked how MySQL actualy eats RAM.
Setting max_connections isn’t an exercise in wild guesses at highest possible value; it’s a bit of math about available memory vs Each connection has its own overhead. A calculator does most of the work for you, but knowing what it’s calculating prevents your box from swapping to disk on a busy Friday afternoon.
How to Set Max Connections Correctly
MySQL’s issue is that it has a dual view of memory: some pieces are static allocations (such as the size of the InnoDB buffer pool). Others are dynamic allocations. There is one for every connection, transaction, or thread. These scale to match, multiplying based on number of clients connecting to database. When all 20 is sitting around idle, everything’s fine and your memory footprint is not high. However, when 20 queries simultaneously execute, each wanting its own temporary table space and sort buffers, your available memory dissapears rapidly.
Your challenge is determining how many of those connection will be doing heavy lifting at any given instant. People tend to over-estimate how much their idle connections cost and under-estimate what an active one costs. Sure, an idle connection consumes little more than a few hundred KB (depending on your build) of stack memory. It is nothing serious unless thousands of them bring you down. The real kicker is buffers which are only allocated for each session when needed by a query. Large temp tables, un-indexed joins and sort operations can easily requires megabytes per session. And if your app layer lets too many simultaneous queries reach the db at once then those per-session buffers will add up quicker than you can reboot the service.
That’s where this whole notion of “active percent” comes into play. Most production applications don’t keep all their database connections simultaneously running some complicated join statement in unison. At most, there may be hundreds of persistent connection held open by your database pooler; however, only a small subset of those are actively running SQL queries at any millisecond in time. By telling the tool what that percentage is it can then account for idle overhead but reserve sufficient headroom for your active workload.
It’s also important to subtract some space for the operating system. Linux require some memory for process management and page caching. MySQL requires some global buffers for performance schema data and logs. Remove those known factors first, leaving you with a more accurate representation of what remains available for user connections.
Another important but frequently overlooked factor is admin access. Your server has a maximum on how many concurrent connections can be open at any given time. Regular users will get locked out if they hit this number. Want to log in and see what’s happening? Kill a runaway process? You can’t do that because you didn’t save a handful of these spots for monitoring systems or database admins. Make sure to set aside a few connections just for emergencies. That way, you can still take back control in an emergency. Simple protection against being completely locked out when shit hits the fan.
Ultimately, the decision between these two configurations is one of throughput vs It is a matter of latency. More concurrent connections sounds nice but more connections means more contention, especially when those connection begin to compete with each other for disk I/O and CPU. Fewer, well-chosen connections force your app to queue requests outside the database engine, which is usually smoother than piling them up within the database engine itself. When you size your limits by real-world memory limitations instead of some arbitrary benchmark, you create a predictable system under load. You know exactly how many requests the server can handle, no more wondering if this next query will push it over the edge. That’s far more valuable then a few additional concurrent slots you could of been able to get from an overprovisioned configuration.