🌐 Network Latency Distance Calculator
Estimate one-way & round-trip propagation delay based on distance, medium type, hops, and buffering
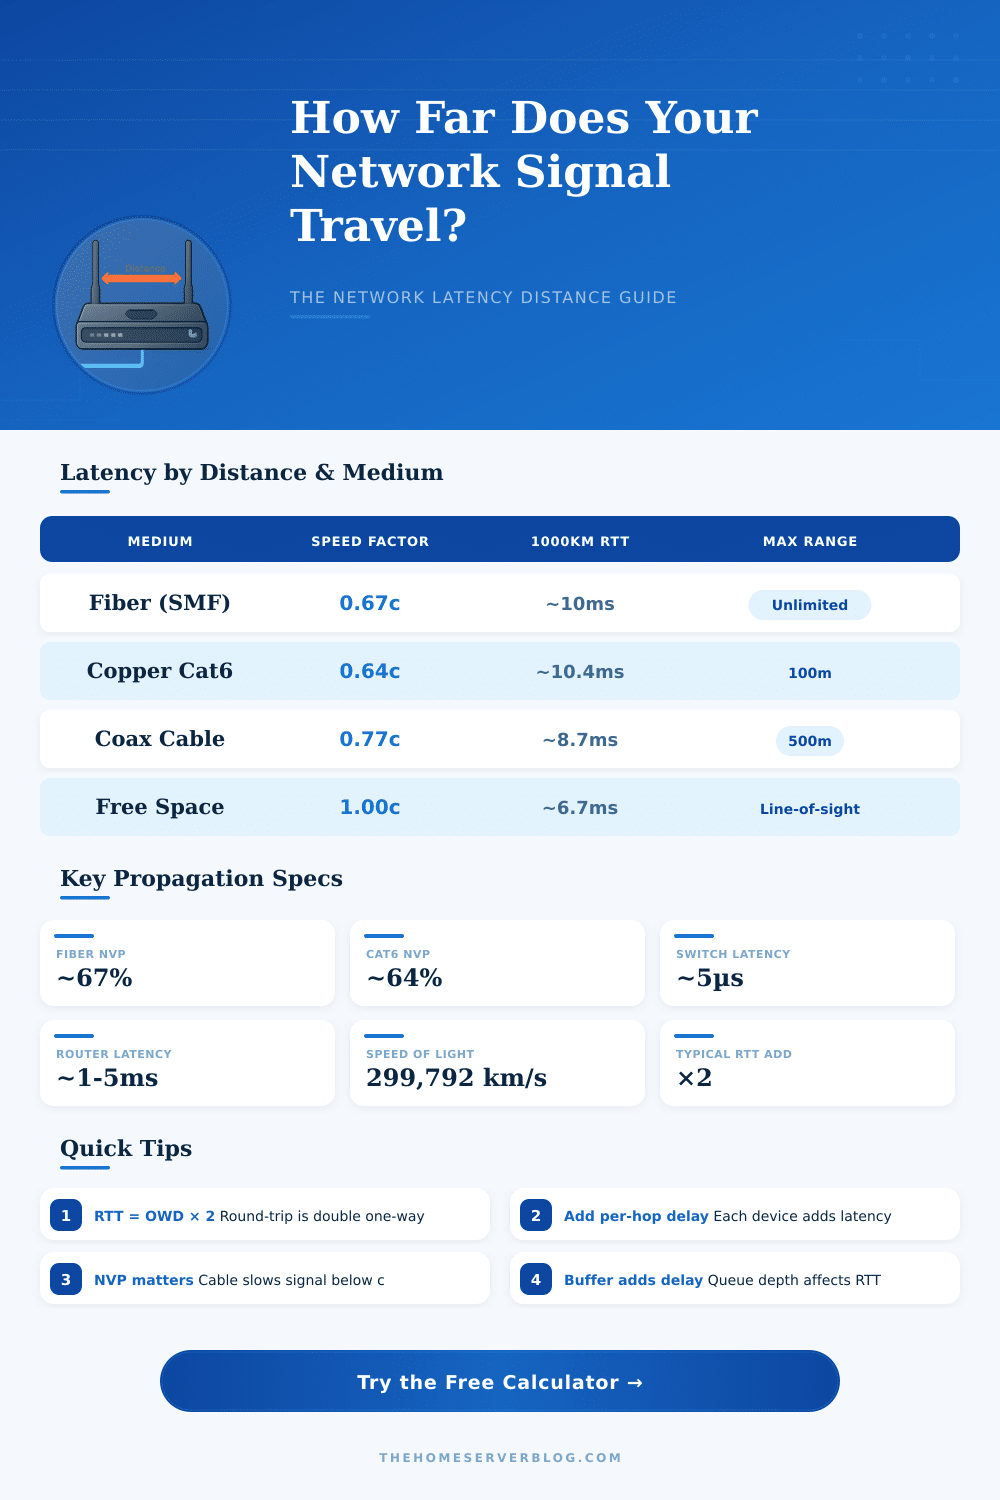
| Medium | NVP (% of c) | Effective Speed (km/s) | Max Segment | Typical Use |
|---|---|---|---|---|
| Fiber SMF (OS2) | 67% | 200,861 | Unlimited (repeaters) | WAN, Metro, Backbone |
| Fiber MMF (OM4) | 67% | 200,861 | 400m @ 100G | Data Center, Campus |
| Cat6 UTP | 64% | 191,867 | 100m (TIA-568) | LAN, Office Runs |
| Cat6A UTP | 64% | 191,867 | 100m (TIA-568) | 10GBase-T LAN |
| Cat5e UTP | 64% | 191,867 | 100m (TIA-568) | Legacy 1GbE LAN |
| Coaxial RG-6 | 77% | 230,840 | 500m (DOCSIS) | Cable TV, DOCSIS |
| Coaxial RG-11 | 78% | 233,838 | 600m | Long Coax Runs |
| Free Space (RF/FSO) | 100% | 299,792 | Line-of-sight | Wireless, MW Links |
| GEO Satellite | 100% | 299,792 | ~35,786 km alt. | VSAT, Broadband |
| Distance | One-Way (ms) | RTT (ms) | With 3 Router Hops | Real-World RTT Est. |
|---|---|---|---|---|
| 100 m (0.1 km) | 0.0005 | 0.001 | 3.001 ms | ~3 ms |
| 1 km | 0.005 | 0.01 | 3.01 ms | ~3 ms |
| 10 km | 0.05 | 0.1 | 3.1 ms | ~3–5 ms |
| 100 km | 0.5 | 1.0 | 4.0 ms | ~5 ms |
| 500 km | 2.49 | 4.98 | 7.98 ms | ~10 ms |
| 1,000 km | 4.98 | 9.96 | 12.96 ms | ~15 ms |
| 5,000 km | 24.9 | 49.8 | 52.8 ms | ~60 ms |
| 10,000 km | 49.8 | 99.6 | 102.6 ms | ~120 ms |
| Standard / Use Case | Max OWD Latency | Max RTT | Notes |
|---|---|---|---|
| ITU-T G.114 Voice (VoIP) | 150 ms | 300 ms | Absolute max for acceptable voice |
| ITU-T G.114 Preferred | 100 ms | 200 ms | Recommended target for VoIP |
| Online Gaming (FPS) | <25 ms | <50 ms | Competitive play requirement |
| Video Conferencing | <150 ms | <300 ms | Cisco/WebRTC recommendation |
| Financial HFT | <0.1 ms | <0.2 ms | Co-location trading systems |
| Industrial Control (IEC) | <1 ms | <2 ms | Real-time automation |
| Datacenter East-West | <0.5 ms | <1 ms | Same rack/pod traffic |
| SD-WAN SLA Typical | <50 ms | <100 ms | Business-grade WAN |
| Scenario | Distance | Prop. Delay (OWD) | Est. RTT |
|---|---|---|---|
| Home LAN Fiber | 1 km | 0.005 ms | ~3.3 ms |
| City Metro Ring | 50 km | 0.25 ms | ~3.85 ms |
| Regional WAN | 300 km | 1.49 ms | ~5.77 ms |
| Cross-Country US | 4,500 km | 22.4 ms | ~49.3 ms |
| US – Europe | 8,000 km | 39.8 ms | ~87.6 ms |
| GEO Satellite Link | 71,572 km | 238.7 ms | ~524.8 ms |
Data sent between two places needs time, simply said, that is the Network Latency. The Distance between those endpoints plays one of the main roles in the cause. If one moves them away from the other, the Network Latency grows.
Do not worry about speed causes even so many other factors add on top of that basic idea.
Why Network Latency Happens
There are tools that guess the Network Latency based on the speed of light in fiber. The problem is that it considers only the spread of the signal. Delays because of routing, encryption, rules of talking and changing of data?
They do not enter in the math. So, testing real nets, one always fidns bigger Network Latency than what the Distance itself would predict.
Fiber always beats wireless when dealing with Network Latency. Passing data between different kinds of nets costs some extra milliseconds always. The loss of cable speed reaches around 8 microseconds each mile (or in metric), about 0.82 milliseconds for every 100 kilometers.
The Network Latency also grows because of jumping of packets through routers or switches, wear NAT adds its own delay.
Consider a line of fiber long 1000 km., and you find at least 10 to 30 milliseconds of Network Latency. In theory light could cover 100 kilometers in around 0.3 milliseconds. Real nets even so never reach that ideal.
Local nets with only some switches? Usually they add under 1 millisecond of extra delay. One single switch adds only 1 or 2 microseconds.
When the traffic enters the bigger internet, the time of spread becomes the main cause of slowness. Pings in the same city usually range between 10 and 40 milliseconds. Pings in the same continent reach 40 to 160 milliseconds.
Paths between continents then jump to higher numbers.
Here is where it gets weird, the physical nets do not always follow the map. Traffic sometimes travels hundreds of kilometers sideways before correcting. Every jump through a router adds half a millisecond or more.
Gathering 5 to 10 such jumps, something that started at 10 milliseconds can rise to 50, even 100. Nets for delivery of content help against that by spreading servers by geography, so that data stays in the local ISP of the user.
Queue wait adds its own delay. Links at 90% of capacity have about 9 packets in the buffer. Push to 99% and you have around 99 packets.
In fast core nets, those queues end quickly. Slower connections? They build up delays.
Even so Distance stays the main factor almost always for finding the Network Latency. Wi-Fi especially adds between 5 and 50 milliseconds compared to Ethernet, although that changes based on the traffic conditions. A wiredconnection pinging the local gateway lasts around 1 to 2 milliseconds.