PostgreSQL recovery and replica planning
PostgreSQL WAL Size Calculator
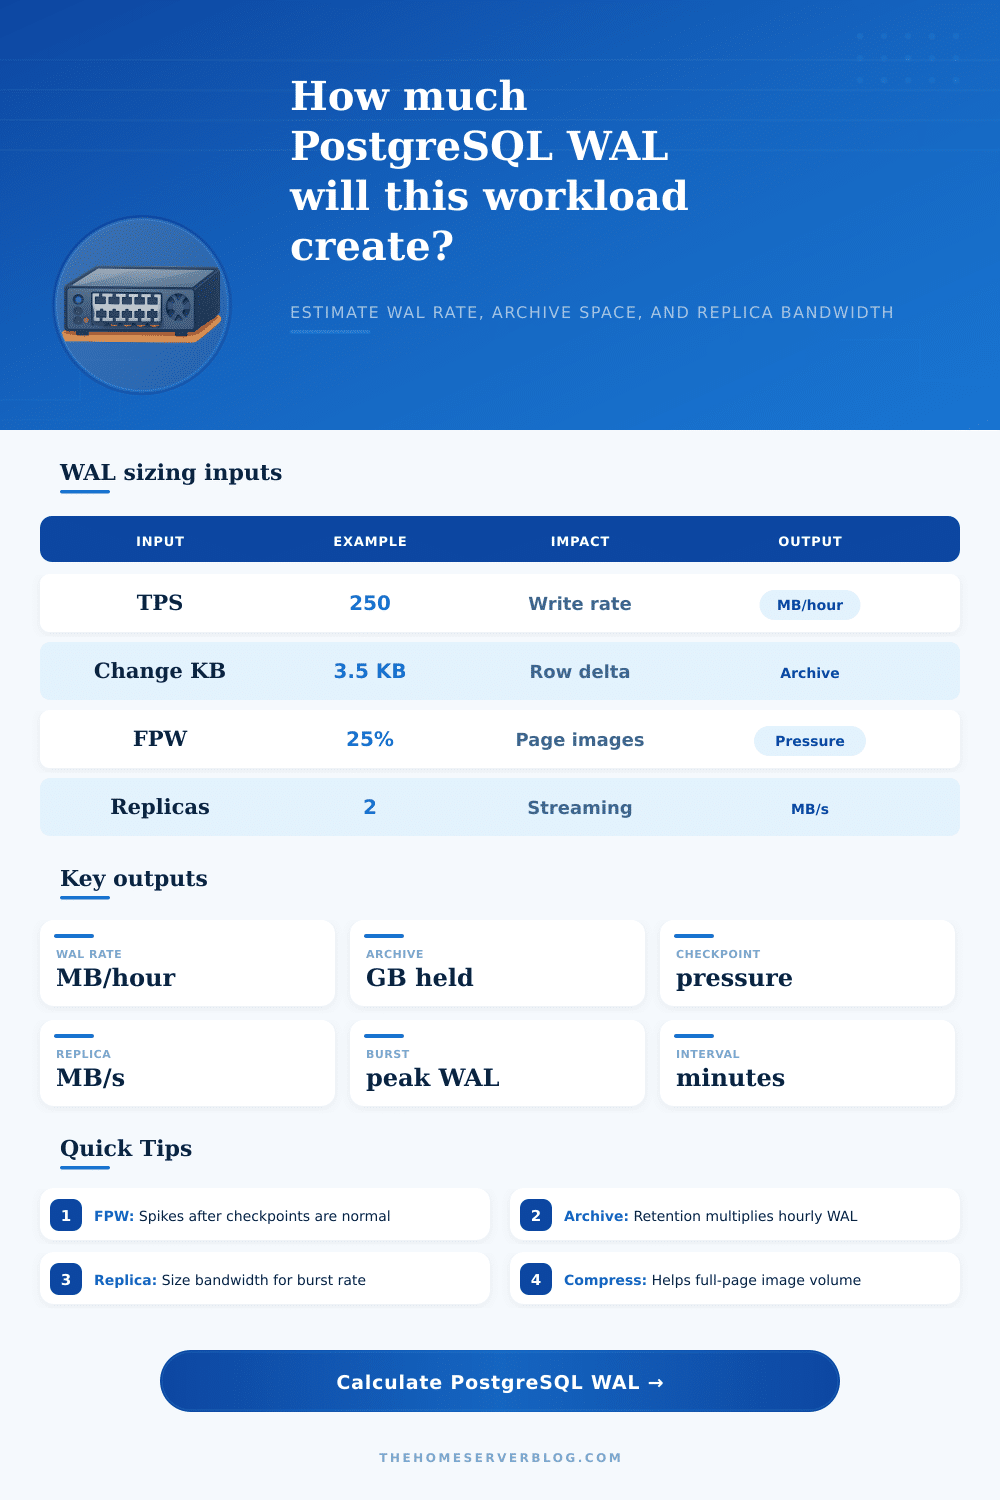
Estimate Write-Ahead Log volume from write TPS, average row change size, full-page-write overhead, checkpoint interval, wal_compression, replica count, archive retention, and peak burst factor.
WAL calculation breakdown
Pressure reading
wal_compression off
Lowest CPU overhead, but full-page images are written at their larger uncompressed size after checkpoints.
wal_compression on
Reduces full-page image volume for many workloads; measure CPU and replay cost before relying on the saving.
Full-page writes
Protects pages from torn writes. Disabling is rarely appropriate outside specialized storage validation.
Archive mode
Every completed WAL segment must be copied reliably before it can be considered protected for recovery.
Replication slots
Slots protect lagging replicas from missing WAL, but retained WAL can grow until the replica catches up.
Checkpoint interval
Longer intervals often reduce repeated full-page images, while shorter intervals can raise WAL churn.
| Workload pattern | Typical write TPS | Row change size | FPW overhead | Planning note |
|---|---|---|---|---|
| Small OLTP app | 20 to 150 TPS | 1 to 4 KB | 10% to 35% | Usually archive capacity is easier than replica bandwidth. |
| Busy SaaS API | 300 to 1,500 TPS | 2 to 8 KB | 20% to 60% | Watch checkpoint timing during deploys and traffic peaks. |
| Bulk load window | 1,000 to 8,000 TPS | 4 to 32 KB | 5% to 25% | Short bursts can dominate archive storage for the day. |
| Update-heavy CRM | 100 to 900 TPS | 5 to 20 KB | 25% to 90% | Index churn and HOT update misses can expand WAL quickly. |
| Time-series inserts | 500 to 10,000 TPS | 0.5 to 3 KB | 5% to 30% | Many small records need bandwidth sizing even when rows are tiny. |
| Signal | Low pressure | Moderate pressure | High pressure | What to inspect |
|---|---|---|---|---|
| WAL per checkpoint | Under 512 MB | 512 MB to 2 GB | Over 2 GB | checkpoint_timeout, max_wal_size, write spikes |
| Archive rate | Under 2 GB/hour | 2 to 20 GB/hour | Over 20 GB/hour | archive_command, archive lag, object storage throughput |
| Replica stream | Under 2 MB/s | 2 to 20 MB/s | Over 20 MB/s | Network headroom, wal_sender, replay delay |
| Retained WAL | Under 50 GB | 50 to 500 GB | Over 500 GB | Retention policy, slots, backup cadence |
| FPW overhead | Under 20% | 20% to 70% | Over 70% | Checkpoint churn, page dirtiness, wal_compression |
| Feature | Changes WAL size? | Changes recovery? | Capacity impact | Operational caution |
|---|---|---|---|---|
| wal_compression | Yes, mainly FPW | Replay must decompress | Often lowers archives | CPU impact varies by data and method. |
| checkpoint_timeout | Indirectly | Affects redo window | Longer windows can reduce FPW repeats | Balance restart time and write smoothing. |
| max_wal_size | Indirectly | Affects checkpoint frequency | Too small can force extra checkpoints | Frequent checkpoints can increase WAL. |
| archive_mode | No | Enables PITR archives | Requires durable storage | Failed archiving can block WAL recycling. |
| Streaming replica | No | Consumes WAL stream | Needs outbound bandwidth | Slots can retain WAL during replica lag. |
| UNLOGGED table | Greatly reduces | Not crash safe | Useful for rebuildable staging data | Data is truncated after crash recovery. |
Sometimes your database seems fine, then a nightly batch job comes through and blows away all of your disk during the night. It’s not necessarily a bug. This can happen when calculations weren’t done before deployment. Or perhaps it’s a feature: PostgreSQL writes out all changes in a Write-Ahead Log to ensure data integrity; each change are written out before hitting the main tables. But the WAL just keeps growing. You don’t notice it. So either you overpay for unanticipated storage space, or your replication fall behind because your network pipe is choked with log segments.
Once you’ve set write intensity, then the calculator (above) do the math for you. It turns those ideas into real-world capacity plans. Start by considering the transaction rate. That’s a combination of inserts, updates and deletes. Unless you’ve paid careful attention to how your indexes covers data and how you manage hint bits, an update tend to write more to the log than an insert. It has to record the state of old tuple in case there’s a need to recover from it.
How to Plan Your PostgreSQL Storage Needs
The average row change size matter here. Is your schema lean? Then the payloads are small. Are you storing lots of wide text fields, or large JSONB objects? The delta increases rapid, and people underestimate it. They only see the size of the stored object, not the size of what gets written out during mutations.
Full-page images have a hidden weight. When PostgreSQL touches a data page for the first time after a checkpoint, it will write a full copy of that page to disk, in case it’s corrupted there. There is no way to turn this feature off to prevent corruption, but it greatly increases your log volume during maintenance windows. The tool takes this overhead into account, expressed as a percentage of your overall volume.
Compression helps with this. It doesn’t necessarily reduce the size of each individual record, but it absolutely shrinks down those full-page images. Those savings compound fast if you have an update-heavy workload, fast enough that it might be worth the CPU overhead of decompressing them on replicas.
The length of your checkpoint interval matters more then most admins think. A shorter interval leads to more frequent checkpoints. This causes more full-page image to be written from newly-dirtied pages. Conversely, a longer interval smooths out write pressure, but increases your recovery time (RTO) if something go wrong. That’s a resources-vs-safety trade-off.
The calculator simulates that behavior, modeling the way it spreads your workload over the checkpoint window. You’ll notice it shows how many logs build up before each major sync event. If the number gets too high, you’ll notice spikes in I/O latency as PostgreSQL flushes all its dirty buffers to disk at the same time.
The other silent killer is replication bandwidth. Your busy primary will be generating megabytes per second of write-ahead logs. This traffic goes across the network to each standby server. If you have three replicas and double your peak burst rate from baseline, then you’ll require six times your steady-state throughput on the primary’s egress port. This bottleneck can become apparent during failover testing: when you run the failover process, it causes a sudden increase in log generation as the new primary catches up with its state. The tool calculates a total bandwidth requirement that takes into account both your replicas and your burst factor (for spikes beyond our control).
For archive storage, it’s just a matter of time. How many point-in-time recoveries do you need? The rest is math. Hundreds of gigabytes of disk (or equivalent cost of cloud object storage) may be all that’s needed for three days’ worth of retention on a high churn system. Cheap, until it isn’t.
The reference table on this page helps break down typical workload patterns so you can see where you fit in relative to known baselines. That’ll help ground your expectations. So, WAL sizing is a matter of risk vs. It is a matter of spending resources. You shouldn’ve want too little and be on fire when disaster strikes, but you also don’t want so much that you’ve provisioned for every edge case.
Reach into the tool and see what’s in there. Check your real world logs at peak times and confirm your calculations. It will clearly show you exactly where your bottlenecks are before they become outages.