QoS Bandwidth Calculator
Plan WAN shaping, priority queues, voice/video reservations, and bulk traffic limits before a busy uplink turns into latency spikes.
| Traffic Class | Typical DSCP | Per-Session Planning Rate | Queue Behavior |
|---|---|---|---|
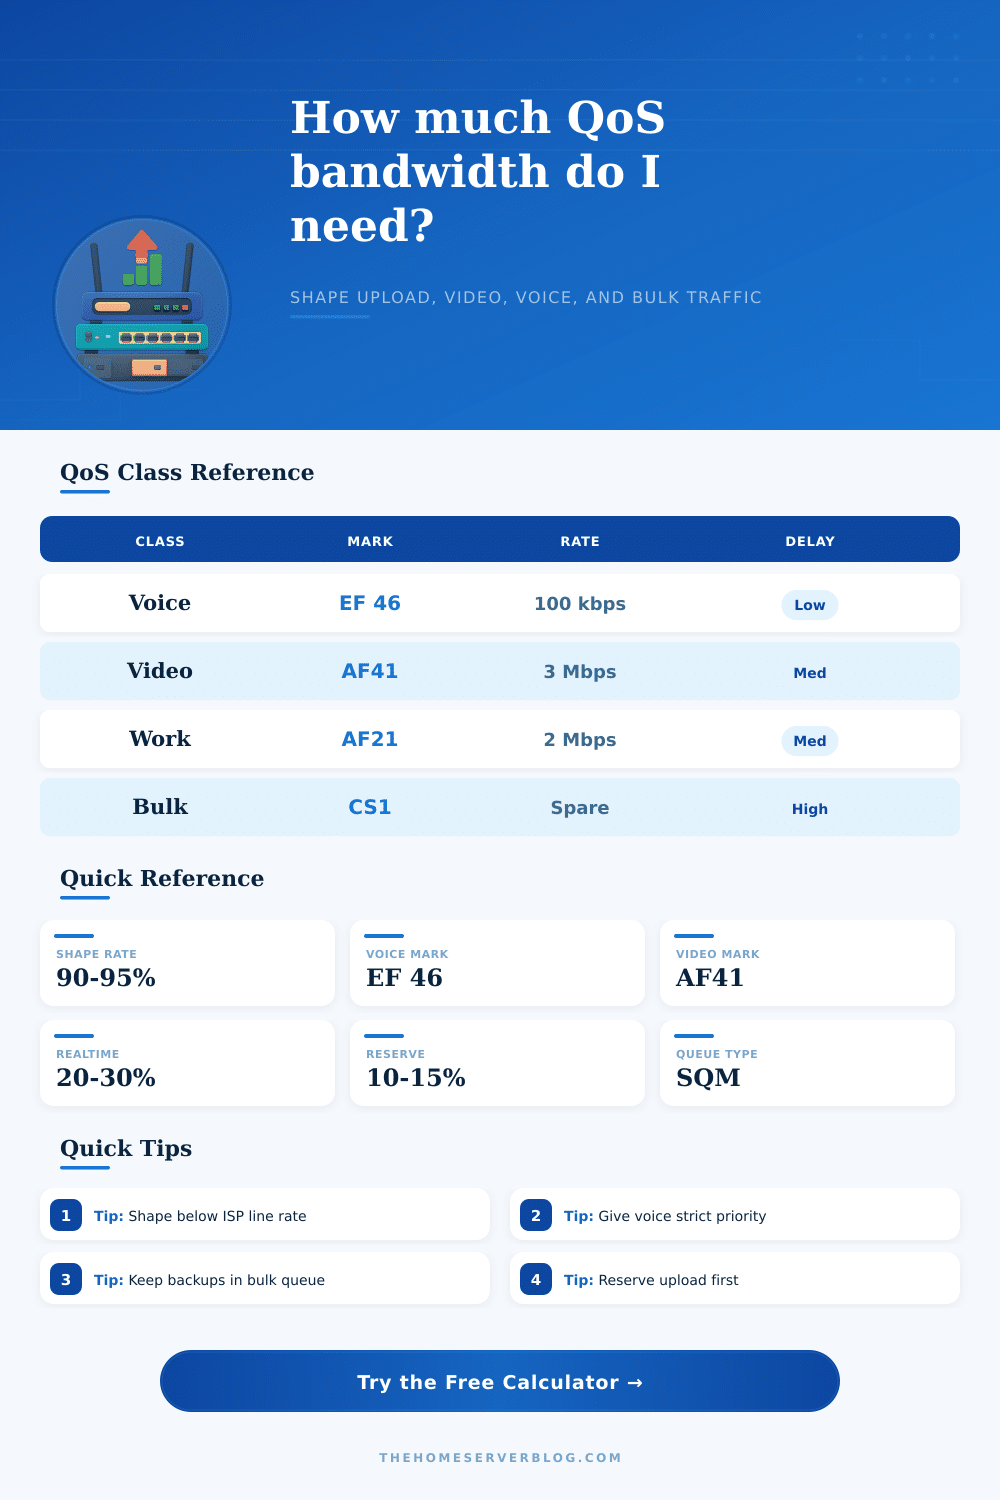
| Voice and Wi-Fi calling | EF 46 | 80 to 120 Kbps each direction | Strict priority with small queue |
| Interactive video meetings | AF41 or AF42 | 2.5 to 4 Mbps per HD call | Priority queue with fair sharing |
| Gaming and SSH | CS5 or AF31 | 0.2 to 1 Mbps per client | Low latency queue, not high bandwidth |
| Work apps and browsing | AF21 or default | 1.5 to 3 Mbps per active device | Default fair queue with minimum share |
| Streaming media | Default or AF11 | 5 Mbps HD, 25 Mbps 4K | Normal queue, download weighted |
| Backups and sync | CS1 scavenger | Use leftover capacity | Bulk queue, capped when latency rises |
| WAN Type | Recommended Shaper | Extra Reserve | Practical Note |
|---|---|---|---|
| Fiber | 95% to 98% of measured rate | 5% | Stable latency, download shaping may be optional |
| Cable | 90% to 95% of measured upload | 10% | Shared-node bursts make upload shaping valuable |
| DSL | 85% to 92% of sync rate | 15% | Small uplinks need conservative queues |
| LTE or 5G | 70% to 90% of low-hour speed | 20% | Variable radio speed needs jitter headroom |
| Satellite | 70% to 85% of recent speed test | 20% | Latency floor is high, buffer control still helps |
| Dual WAN | Shape each WAN separately | 10% | Do not average two unequal uplinks blindly |
| Scenario | Link Speed | Priority Reserve | Bulk Limit |
|---|---|---|---|
| Two-person remote work | 300/20 Mbps | 5 to 8 Mbps upload | 6 to 10 Mbps upload |
| Gigabit fiber home lab | 940/940 Mbps | 50 to 150 Mbps | 300 to 600 Mbps |
| DSL with VoIP | 50/5 Mbps | 1.5 to 2.5 Mbps | 1 to 2 Mbps |
| Creator upload workflow | 1000/40 Mbps | 10 to 14 Mbps | 16 to 24 Mbps |
| LTE backup router | 80/12 Mbps | 3 to 5 Mbps | 2 to 4 Mbps |
Bufferbloat happen when a router receives more data than the connection can process. Bufferbloat causes a digital traffic jam that mess up real-time communication. Bufferbloat can happen when someone else perform a long download or backup while you is on a video call.
Your voice may sound robotic, your screen may freeze, and the call may drop. Even if you have a high download speed, if your upload speed is too low for your data usage, bufferbloat can occur. Quality of Service (QoS) tell your router what kind of data is important and what data can be ignored.
Stop Bufferbloat and Keep Your Calls Clear
This does not increase your bandwidth, as no amount of QoS will give you more bandwidth than your internet service provider provide. Quality of Service manage your available bandwidth. The goal is to allow small voice data packets to go through without being delayed by large data packet of files being synced from Dropbox.
Use a calculator to find how much bandwidth your upload speed can have to ensure that your network does not choke on its own data. Your advertised internet speed from your service provider are not the same as your actual speed. Your cable or DSL line may not be able to maintain the advertised speed.
If you set your shaping rate to the same as your internet service provider’s limit, your modem might become a bottleneck for your network. A bottleneck cause latency spikes. Set your rate to slightly lower than your service provider’s advertised speed so that your router can own the queue.
When the router owns the queue, it can decide what packet go through the router first. This will reduce the lag in your network. Your connection play a role in how your Quality of Service settings work.
For instance, fiber connection are more stable and easier to manage with Quality of Service settings. However, if you have a cable connection, another device in the same subnet as you can take your bandwidth. Additionally, if you have an LTE or satellite connection, your bandwidth can be volatile and cause jitter.
If you have a cellular connection, use a larger safety buffer in your Quality of Service settings to account for these fluctuation in your connection speed. When defining class of traffic, do not mark all traffic as high priority. If you mark all traffic as high priority, nothing will be marked as a priority.
Voice calls should of been marked as high priority because they require immediacy in data transfer but use little amount of bandwidth. Video calls use more bandwidth than voice calls but are more forgiving. Bulk traffic like NAS device or torrent traffic should be marked as scavenger traffic as it does not use much bandwidth.
The calculator for Quality of Service will tell you how much you can shape your upload speed and how much bandwidth you should reserve for real-time traffic. The real-time reserve will ensure that data from voice and video calls is always fluid. For example, if two device are running Zoom, there must be enough bandwidth for both Zoom connection.
The remaining device will compete for the remaining bandwidth. The bulk cap will set a ceiling for device like NAS drives or torrents from not getting every last bit of your available bandwidth. Quality of Service require some trial and error in its setup.
Your latency under heavy load will show you if your Quality of Service settings is set to the correct value. If your ping spike when a file is uploading, your shaper is set to too high a value. Find the perfect setting where your bandwidth is maximized but not reaching the limit of your internet connection.
Once you have configures your shapers and reserves, your network will work more smoothly and your voice calls will remain clear when others is performing cloud backups.