🖥️ Server Uptime Calculator
Calculate allowed downtime, SLA compliance, and availability targets for any server or service period
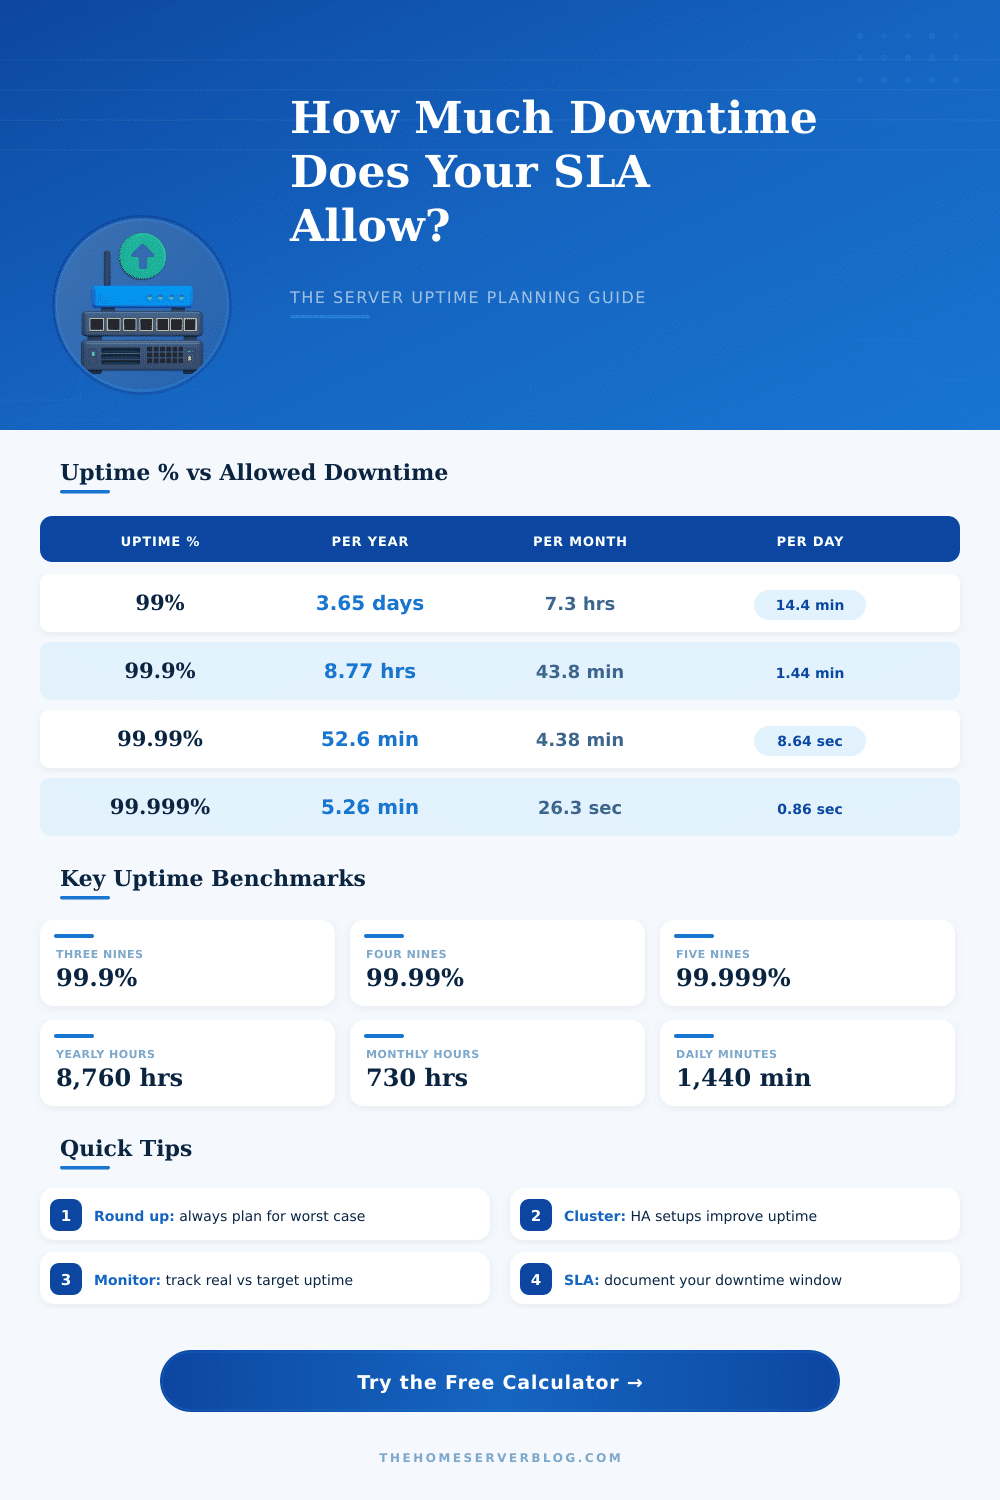
| Uptime % | Per Year | Per Month | Per Week | Per Day |
|---|---|---|---|---|
| 99% (Two Nines) | 3 days 15.6 hrs | 7 hrs 18 min | 1 hr 40.8 min | 14 min 24 sec |
| 99.5% | 1 day 19.8 hrs | 3 hrs 39 min | 50.4 min | 7 min 12 sec |
| 99.9% (Three Nines) | 8 hrs 45.6 min | 43 min 49 sec | 10 min 4.8 sec | 1 min 26.4 sec |
| 99.95% | 4 hrs 22.8 min | 21 min 54 sec | 5 min 2.4 sec | 43.2 sec |
| 99.99% (Four Nines) | 52 min 35.7 sec | 4 min 22.8 sec | 1 min 0.48 sec | 8.64 sec |
| 99.999% (Five Nines) | 5 min 15.6 sec | 26.28 sec | 6.05 sec | 0.864 sec |
| 99.9999% (Six Nines) | 31.5 sec | 2.63 sec | 0.605 sec | 0.0864 sec |
| Server / Service Type | Typical Target | Max Downtime/yr | HA Required | Typical Config |
|---|---|---|---|---|
| Web Server | 99.9% | 8.77 hrs | Recommended | Load Balanced Pair |
| Database Server | 99.99% | 52.6 min | Yes | Primary + Replica |
| API Service | 99.99% | 52.6 min | Yes | Multi-region |
| E-Commerce Platform | 99.95% | 4.38 hrs | Yes | CDN + Failover |
| Critical Application | 99.999% | 5.26 min | Required | Active-Active Cluster |
| Development Server | 99.5% | 43.8 hrs | No | Single Node |
| Backup Server | 99.0% | 87.6 hrs | No | Standalone |
| Home Lab / Proxmox | 99.0% | 87.6 hrs | Optional | Single Host or 3-Node |
| Proxmox Cluster (HA) | 99.9% | 8.77 hrs | Built-in | 3+ Node Quorum |
| NAS / Storage | 99.9% | 8.77 hrs | Recommended | RAID + UPS |
| SLA Tier | Uptime % | Annual Downtime | Monthly Downtime | Industry Use |
|---|---|---|---|---|
| Basic Hosting | 99% | 87.66 hrs | 7.31 hrs | Shared Hosting |
| Standard SLA | 99.5% | 43.83 hrs | 3.65 hrs | SMB Servers |
| Business SLA | 99.9% | 8.77 hrs | 43.8 min | Business Critical |
| Premium SLA | 99.95% | 4.38 hrs | 21.9 min | Enterprise Apps |
| High Availability | 99.99% | 52.6 min | 4.38 min | Finance / Health |
| Carrier Grade | 99.999% | 5.26 min | 26.3 sec | Telecom / ISP |
| Ultra HA | 99.9999% | 31.5 sec | 2.63 sec | Safety-Critical |
| Project / Setup | Uptime Target | Annual Downtime Budget | Monthly Downtime Budget |
|---|---|---|---|
| Home Lab (Proxmox, 1 node) | 99.0% | 87.66 hrs | 7.31 hrs |
| Proxmox 3-Node Cluster | 99.9% | 8.77 hrs | 43.83 min |
| Self-Hosted Web App | 99.9% | 8.77 hrs | 43.83 min |
| Business Database | 99.99% | 52.6 min | 4.38 min |
| Dev / Test Environment | 99.5% | 43.83 hrs | 3.65 hrs |
| NAS Storage (RAID) | 99.9% | 8.77 hrs | 43.83 min |
| Monitoring / Alerting Server | 99.95% | 4.38 hrs | 21.9 min |
| E-Commerce Site | 99.95% | 4.38 hrs | 21.9 min |
The Uptime of a Server is the time during which it stays working and reachable. The downtime of a Server is the opposite, that is the time when it does not work or can not be reached. Simply the Uptime tells you about the length of time in which the Server worked without shutting down.
That measure is important, because it shows the stability and reliable nature of the Server, including hardware and software.
What Server Uptime Means and Why It Is Important
Here something useful to know. Even if a website or program, that the Server hosts, are down, the Server itself can have high Uptime. The Uptime of a website and that of a Server is linked, but not the same.
The Server can run fine, while the website on it fails because of mistakes in apps or problems with data.
The meaning of Uptime changes based on what you measure. It can show how much time the system was on, how long the working system lasted or how much time a certain program was used. In Linux Servers commonly show Uptime that extends in years.
Some reported Servers that worked more than seven years without restart. One unused Server was found with Uptime of 2487 days.
Even so, very long Uptime not always is good. A computer with very high Uptime probably did not receive safe updates. Using an old core can open the Server too attack.
Any single Server should not be so central that it never shuts down. The main secret for keeping services reachable does not rest in systems that never restart. Rather, it is in a group of systems that can cover parts that fail.
Turning Servers off one by one for updates, without stopping the service, is a smart method. Extra switches, power and links also are useful.
Many aim for 99.99% Uptime, but that value can be tricky. Some limit it to time outside planned care windows. So, if a Server shuts down during planned care, that pause does not affect the percentage.
Checking Uptime in Linux is simple, you just enter the command „uptime” in the terminal. It shows days, hours, minutes and seconds since the last restart. In Windows, commands in PowerShell, like „get-uptime”, work.
Older versions of Windows had a special tool for that, which did not need extra programs.
Monitoring tools help to follow everything. Programs can check Uptime, SSL certificates, ports and cron tasks in real time, and right away warn when something fails. Some monitoring programs have features like a process viewer in real time, which lets you remove unwanted processes that use resources of the Server.
Uptime Kuma is a famous self-hosted option, that even works with Prometheus and Grafana for dashboards. Tools for network monitoring also show broken devices, missing diskspace and use of memory before a crash will happen.