HomeServerBlog reliability planner
SLO Compliance Calculator
Check whether a home lab service is inside its service level objective by combining request failures, slow responses, planned maintenance policy, downtime equivalents, error budget, and rolling burn rate.
▣SLO scenario presets
⚙SLO window and signal inputs
SLO formula breakdown
Budget health
💻Monitoring equipment/spec comparison grid
For SLO math, request counters and latency histograms are better than screenshots of uptime. Use probes when the app does not expose useful metrics.
📐Derived service metrics
Target error rate multiplied by eligible events.
Failures plus latency misses plus counted outage equivalents.
Objective minus observed p95 latency.
Budget held back for releases and unexpected incidents.
📚SLO reference tables
Availability target to downtime allowance
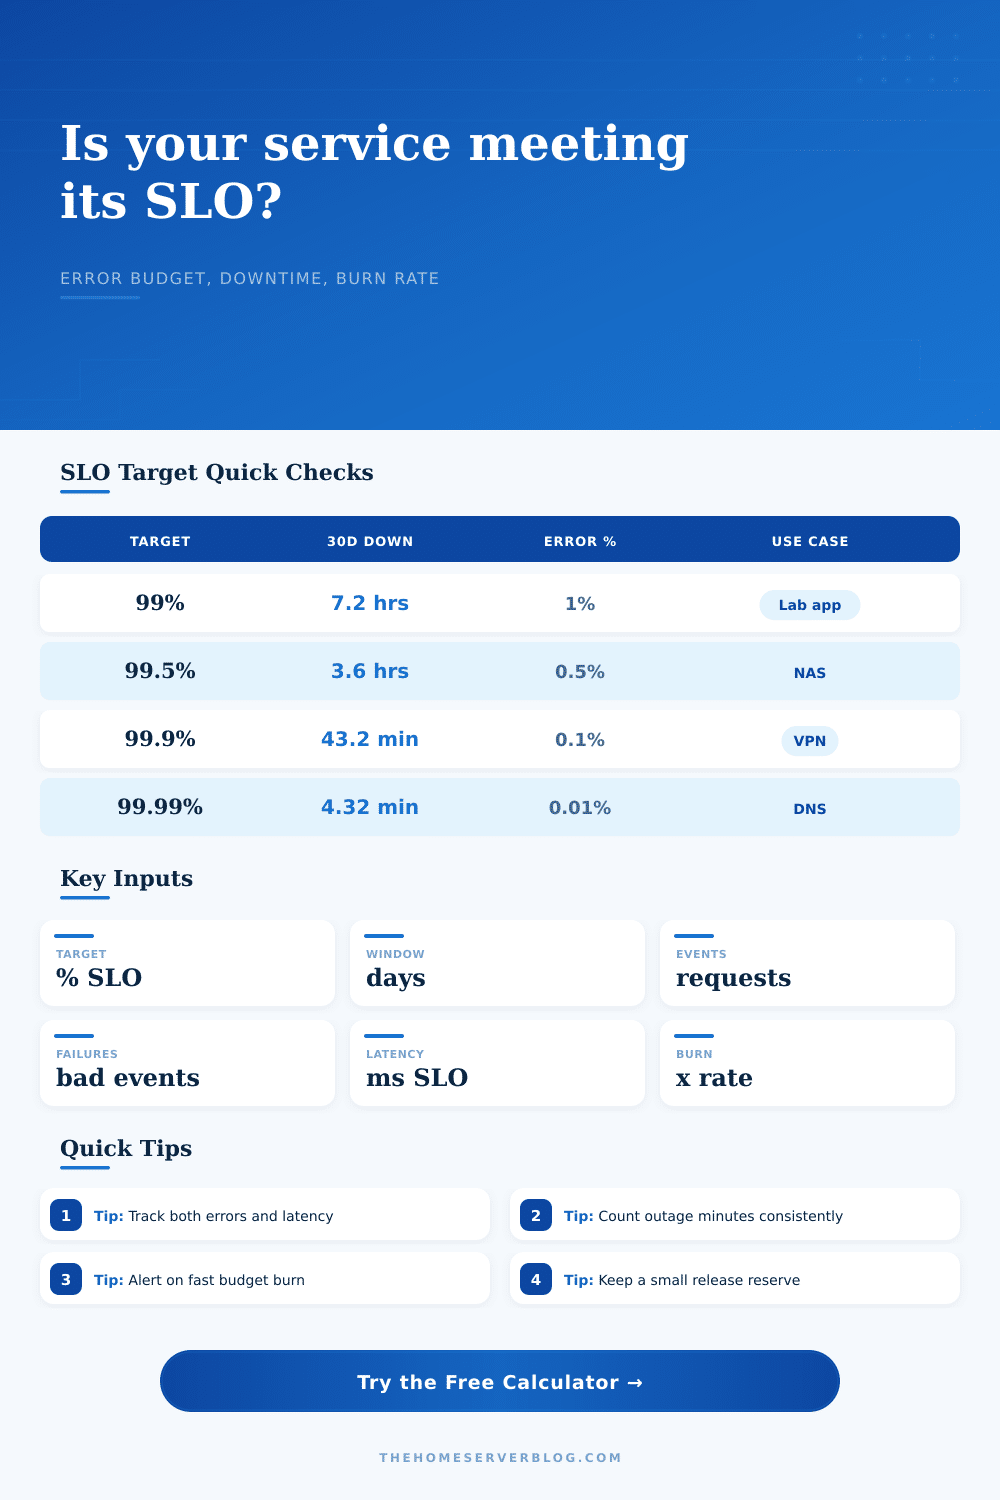
| SLO Target | Error Budget | 30-Day Downtime | Best Home Lab Fit |
|---|---|---|---|
| 99% | 1% bad events | 7 hr 12 min | Media server, dev apps, noncritical dashboards |
| 99.5% | 0.5% bad events | 3 hr 36 min | Family file sync, photo backup, admin portals |
| 99.9% | 0.1% bad events | 43 min 12 sec | VPN, reverse proxy, authentication, monitoring |
| 99.95% | 0.05% bad events | 21 min 36 sec | Important remote access with redundancy |
| 99.99% | 0.01% bad events | 4 min 19 sec | DNS, critical ingress, always-on automation |
Error budget burn-rate guide
| Burn Rate | Meaning | Budget Impact | Typical Action |
|---|---|---|---|
| 0-1x | Inside planned error rate | Budget lasts the full window | Watch dashboard during normal maintenance |
| 1-2x | Budget is draining slowly | May miss target if sustained | Check recent deploys, certificates, DNS, disks |
| 2-6x | Clear reliability regression | Several days of budget can vanish | Pause changes, repair the highest-error path |
| 6-14x | Fast burn incident | Monthly budget can drain quickly | Page owner, rollback, fail over, disable noisy jobs |
| 14x+ | Severe user-visible outage | Budget may be gone in hours | Declare incident and prioritize restoration |
Telemetry sampling and retention choices
| Signal | Good Resolution | Retention | SLO Use |
|---|---|---|---|
| HTTP request counter | 15-30 seconds | 35-90 days | Computes good, failed, and total event rates |
| Latency histogram | 15-30 seconds | 35-90 days | Counts requests beyond latency objective buckets |
| Synthetic probe | 30-60 seconds | 90 days | Captures black-box availability when app metrics are missing |
| Incident annotation | per event | 1 year | Explains maintenance, ISP faults, updates, and rollbacks |
| Host saturation | 1-15 seconds | 14-35 days | Links SLO misses to CPU steal, RAM pressure, IO wait, or packet loss |
Common home server SLO patterns
| Service | Suggested SLO | Latency Objective | Primary Risk |
|---|---|---|---|
| Recursive DNS | 99.9-99.99% | 100 ms | Router reboot, upstream resolver, cache miss storms |
| VPN gateway | 99.5-99.9% | 500 ms | ISP changes, dynamic DNS, expired certificates |
| NAS share | 99-99.5% | 1000 ms | Disk scrub, ZFS resilver, sleeping disks, network saturation |
| Home Assistant | 99.5-99.9% | 300 ms | Database stalls, add-on restart, Zigbee or Z-Wave bridge loss |
| Media app | 98-99.5% | 1500 ms | Transcode overload, metadata scans, storage throughput |
💡SLO calculation notes
You create a media server, spending hours tuning it. Your firewall’s tuned. Lights is automated to come on/off at the right time. Then it’s Tuesday afternoon and the router reboots. The internet drops out. Your home lab are down for 20 minutes. You get it up and running again quickly, but did you meet your reliability goals?
Most self-hosting enthusiasts don’t ask that question of themselves until it’s too late. There’s no such thing as on or off when it comes to reliability. It is something you spend every day. It’s a budget.
How to Measure Your Home Server Reliability
Here’s the tool that does all of that arithmetic for service level objectives. Remember: they’re simply reliability contracts you sign with yourself. Tell the tool what your target availability is. Tell the tool how long you measured it over (your measurement window). Then tell the tool how many times it actualy failed. The tool will tell you whether or not you’re within the lines you’ve drawn, and it’ll translate those vague percentages to real minutes of downtime.
Why does that matter? Because 99 percent uptime sounds great, until you realize that it lets you have seven hours of downtime per month. That’s totally unacceptable for something as critical as a DNS resolver; totally fine if its a personal photo archive. And the math will help you figure out where the line goes.
Keep these things in mind when inputting the data. The field for the number of eligible requests has been misinterpreted; it’s not simply all the HTTP hits. It’s also all the complete sync jobs. It’s all the successful health checks. Heck, it’s all the attempted but failed ones (which still count toward that total). If you’re only counting the successfully executed request, then your failure rate will appear artificially low.
The calculator considers not only explicit failures but also missed latencies. For example, if your server respond with a 200 OK but it takes ten seconds to do so, that’s a failure from the perspective of the user experience. Counting slow responses as your bad events provides a truer picture of the service quality, and incentivizes optimizing for speed rather than just availability.
The true magic here is error budgets. They allow you to have a target for reliability instead of perfection, because perfection is both unattainable and insanely expensive. This gives you an idea of how much room you have for error. If your target was 99.9 percent, you get some wiggle room. In fact, you burn through that wiggle room. You realize that by the first week of the month, you has already used it up, so you know you’re doing something wrong.
Now you’ve got a number from the calculator (showing you what you’ve still got) and you can see what your burn rate is (how fast you are going through that safety margin). If that’s high, then you are burning through it to quickly. It is a sign that something isn’t working correctly, and you might not notice until the entire thing is down.
Some people will trip themselves up on what counts as planned maintenance. Do I count a scheduled reboot against my SLO? Some teams don’t count any planned downtime at all, while others count it entirely because, well, the user was interrupted. You can select either option in the calculator. Either way is right (except changing the rule after-the-fact isn’t). It’s not consistent though, and consistency is needed for comparison: this month vs last month. That comparison is how your metrics help you. Without it, they’re just a bunch of numbers floating in space.
There are also more layers of complexity regarding latency goals. If your service is too slow, it doesn’t matter that it’s available. The tool will allow you to define a latency goal, and any request above that latency gets counted as failed. This is important when you’re talking about an interactive service such as a remote desktop gateway. When you’re talking about a file storage service running overnight, a couple of slow requests probably aren’t as big a deal, but it depends on the context.
Think about how your family realy uses the service. Do they watch a lot of movies? Then buffering the stream during movie night is a bad event. If the backup finishes an hour late, that might be acceptable. Maybe she’ll tolerate the backup finishing an hour later.
For a sanity check, we’ve included some reference tables that map common types of home servers to reasonable SLO targets. If your DNS resolver goes down, it breaks everything; therefore it’s worth setting a higher bar than say, a media server. Because you can defer/replace a media server (unlike DNS), it can be less reliable, it will have higher variance. Setting your target based off what actualy matters to users helps ensure you don’t spend time pursuing perfection where it won’t add value, nor ignore degradation that will cause genuine pain.
In the end, though, what compliance tracking does is force someone to be honest. It takes away the illusion that things are all good as long as the servers stay green on the dashboard. And it exposes the price we pay for instability. Now you know how your budget is being drained, so you’re able to make more informed choices regarding when to push out an update.
When do you call off an experiment that has high risk? When should you go patch these systems? What happens if we guess wrong? Can we really afford that lack of reliability?
From there, you manage reliability. Do not guess at it. Downtime should be predictable, but there will still be some downtime.