Time to First Byte Calculator
Estimate TTFB from DNS lookup, TCP connect, TLS handshake, redirects, CDN edge hits, origin distance, backend query time, cache generation time, and server processing.
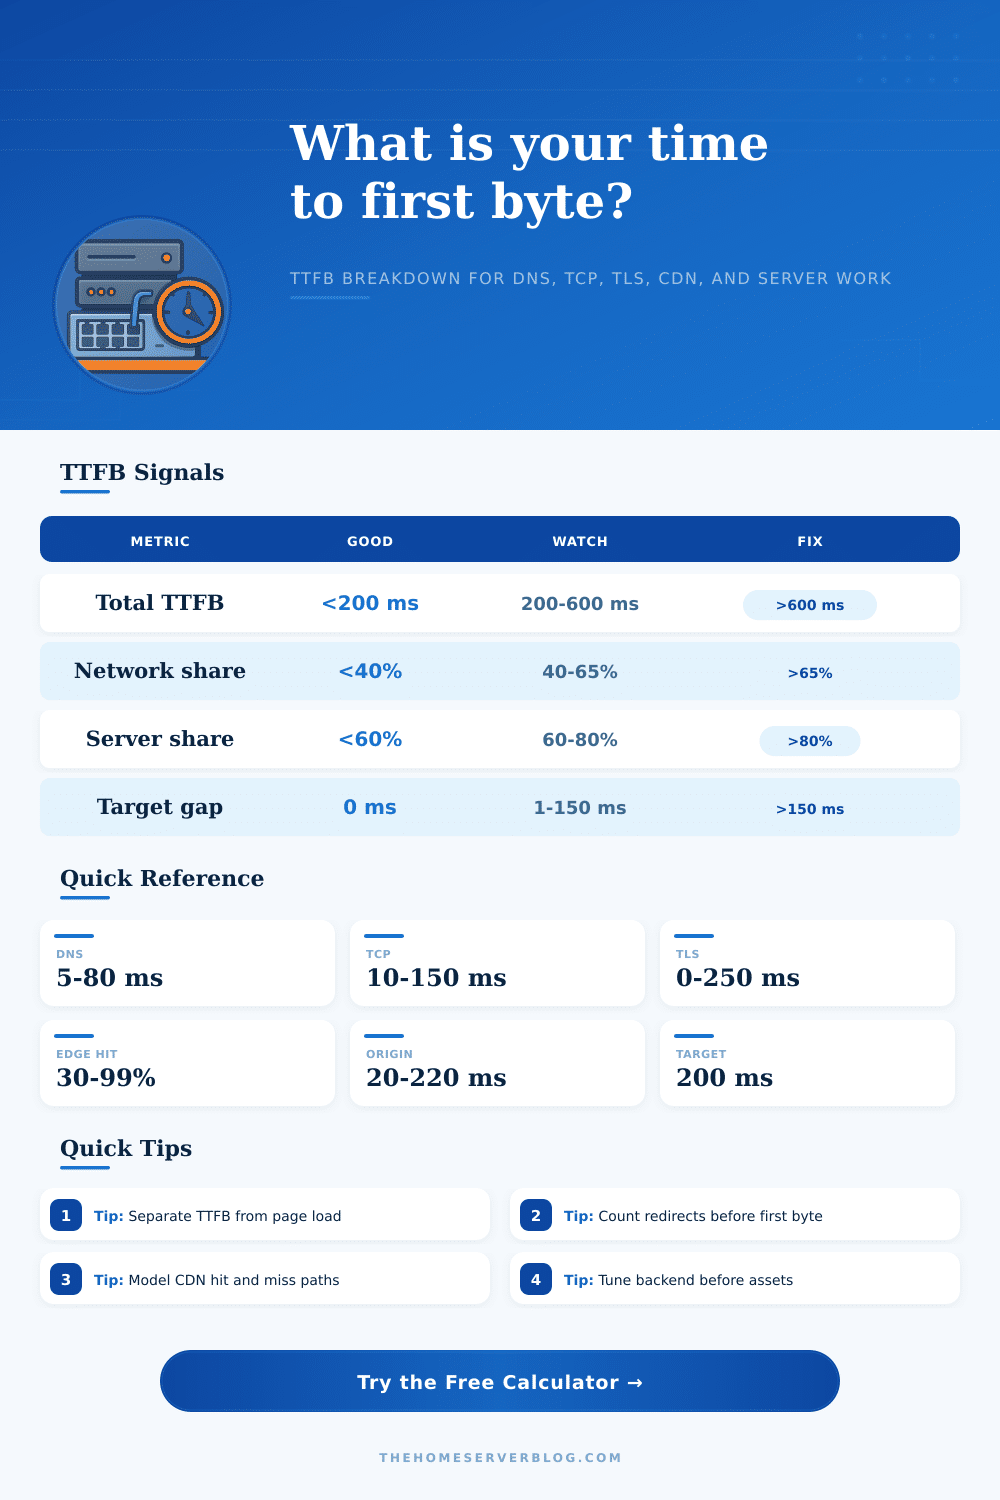
TTFB breakdown
| TTFB range | Signal | Likely user impact | First check |
|---|---|---|---|
| Under 100 ms | Excellent | First byte feels immediate | Keep cache and connection reuse healthy |
| 100 to 200 ms | Fast | Strong target for dynamic HTML | Watch backend p95 and regional routing |
| 200 to 500 ms | Acceptable but visible | Page start can feel delayed on repeat visits | Split network and server shares |
| 500 to 1000 ms | Slow | Users wait before rendering can begin | Check redirects, origin distance, and DB |
| Over 1000 ms | Poor | Often perceived as a stalled request | Treat as server, routing, or cold-start incident |
| Component | Good range | Common high cause | TTFB tuning move |
|---|---|---|---|
| DNS lookup | 5 to 40 ms cached, 40 to 120 ms cold | Resolver distance or uncached delegation | Use reliable DNS, reduce CNAME chain depth |
| TCP connect | 10 to 100 ms | User is far from edge or origin | Move traffic to closer edge or region |
| TLS handshake | 0 to 150 ms | No session reuse, old TLS stack, distant server | Enable TLS 1.3, HTTP/2 or HTTP/3, session resumption |
| Redirects | 0 redirects preferred | HTTP to HTTPS plus www plus locale chains | Collapse redirects into one canonical response |
| Origin distance | 5 to 80 ms regional | CDN miss travels across continents | Use origin shield, closer region, or edge compute |
| Server component | Good range | Warning sign | Practical fix |
|---|---|---|---|
| Application processing | 20 to 120 ms | Framework boot, auth, plugin hooks, queueing | Profile route handlers and remove blocking work |
| Backend query time | 5 to 80 ms | Slow SQL, search, storage, or external API calls | Add indexes, batch queries, cache repeated lookups |
| Cache generation | 5 to 100 ms | Expensive HTML render or serialization on misses | Prewarm, fragment cache, or stale-while-revalidate |
| Cold start | 0 ms when warm | Serverless or container boot delay | Keep warm, reduce bundle size, use provisioned capacity |
| Origin queueing | Near 0 ms | CPU, PHP-FPM, worker, or DB pool saturation | Add workers carefully and fix the bottleneck first |
| Platform pattern | Typical TTFB strength | Typical TTFB risk | Best fit | Improvement lever |
|---|---|---|---|---|
| Static CDN edge | Very low network and server time on hits | Origin fill can still be slow | Static sites, cached docs, images, downloads | Long TTL, hashed assets, prewarm popular URLs |
| Shared hosting | Simple setup and low cost | Noisy neighbors, slow PHP, limited cache control | Small WordPress or low traffic sites | Page cache, object cache, fewer plugins |
| VPS reverse proxy | Predictable when tuned | Region may be far from users | Home server blog, forums, dashboards | Nginx cache, PHP-FPM tuning, closer VPS region |
| Managed WordPress | Built-in page and object cache | Dynamic pages and plugin hooks can dominate | Content sites with editorial workflow | Edge cache HTML, database cleanup, plugin audit |
| Serverless functions | Scales without server management | Cold starts and region mismatch | Burst APIs and light SSR | Warm paths, smaller bundles, regional deployment |
| Edge compute | Close to users for personalized first byte | Origin reads can erase the edge benefit | Auth gates, redirects, A/B routing, light personalization | Keep data at edge, avoid blocking origin fetches |
| Home lab origin | Excellent for LAN users | Residential upload, ISP routing, TLS termination | Private dashboards and self-hosted tools | Tunnel or CDN proxy, local DNS, reverse proxy cache |
When you’re trying to make a slow site fast, you tend to pull up Chrome DevTools. Then you spend some time tweaking image sizes or reducing your JavaScript bundle size. Squeeze, squeeze, squeeeeze. But your big content won’t load for another two seconds!
That’s the time to first byte, or TTFB. And it has little to do with how much space the files takes up on the disk. Instead, it’s about what happens behind-the-scenes: that invisible handshake between server and browser. This calculator will do the math for you. All you have to do is input your backend, TLS, TCP, and DNS times. No need to guess at conversions or coefficients.
What Is TTFB and Why It Matters
For many, TTFB represents nothing but a measurement of their web host’s responsiveness. This isn’t true. TTFB include all the little delays from when you type a URL into your browser until the first character of HTML appear on your screen.
First, there’s DNS resolution, when the browser attempt to look up the IP address. If this take long, nothing else will start happening. Next comes the TLS handshake and TCP connection. These could takes more than a hundred milliseconds depending on server’s location, its power, or any misconfigurations. All of this happens even before any of your application code has executed.
So how do you separate good performance from bad? That’s where the reference table on that page come into play. If you’re seeing something like two-hundred- to five-hundred-millisecond delays, then it’s going to be a mixed problem. Is it the server, or your network path? For a static site served up from a nearby edge node, there is very little server time involved. But you could still have issues if user’s mobile connection is high latency. On the flip side, you might have a powerful local server that processes thing fast, but with poor routing for users in other parts of the world.
That’s where cache comes into play. When using a content delivery network, requests gets served from cache and never reach origin server. So the time it takes to query the backend doesn’t matter on that particular request. The tool factors in edge hits versus misses. It uses misses as a way to model that effect. The lower the cache hit rate, the higher cost for each visitor… All the way back to downloading data and building an HTML page. That adds up quickly. When you have thousands of visitors, even a couple milliseconds longer per miss can slow down what would of been a blazing fast page.
Another major source of delay comes from redirects. Three hops means three round trips to get there, one for each redirect. They all incur the same amount of overhead: DNS and connection. It sounds trivial, but at scale, they suck away your performance budget. When possible, eliminate them and make request go straight where it needs to be.
Serverless cold starts has a similar problem. If your function is spun up from scratch, that initialization time contribute toward your TTFB. Reducing your bundle size helps. Keeping things warm also helps. However, you’ll still pay a latency tax while waiting for the container to become available.
Nobody wants zero milliseconds. That’s never going to happen over public networks. You want something fast enough to feel responsive, which is typicaly less than 200 milliseconds. If you’re often above that number, start figuring out where your time being spent. Is it waiting on the database? Are you waiting for data to travel around the world and hit an origin server? Until you figure out what the bottleneck is, all you’ll do is add some random caching layer, fixing the wrong problem.
Optimizing for TTFB respects the user’s attention span. People don’t care how many CDNs you use, nor do they care about your server specs. They just want the damn page to load. If you know what impacts that initial byte then you’ll stop optimizing for assets and start fixing the underlying delays that block rendering completely. Almost never are these delays related to file size. Knowing that difference will help create an actualy fast web.