VMware Consolidation Ratio Calculator
Estimate vSphere VM capacity from CPU, RAM, HA reserve, CPU ready target, and datastore IOPS constraints.
| Host class | Typical cores | RAM range | Best fit | Watch point |
|---|---|---|---|---|
| Intel NUC / mini PC | 4-14 cores | 32-96 GB | Nested ESXi, DNS, AD, light Linux VMs | Single NIC and thermal limits |
| Single socket tower | 8-24 cores | 64-256 GB | Home lab, NAS services, mixed workloads | Consumer memory capacity |
| Dual socket 1U/2U | 16-64 cores | 128-1024 GB | Dense VM lab or SMB vSphere cluster | Power, noise, and NUMA sizing |
| High core EPYC host | 32-96 cores | 256-2048 GB | Consolidation, nested labs, build farms | Storage queue depth and licensing |
| Edge compact server | 8-24 cores | 64-384 GB | ROBO, firewall, local apps, HA pair | N+1 reserve can dominate |
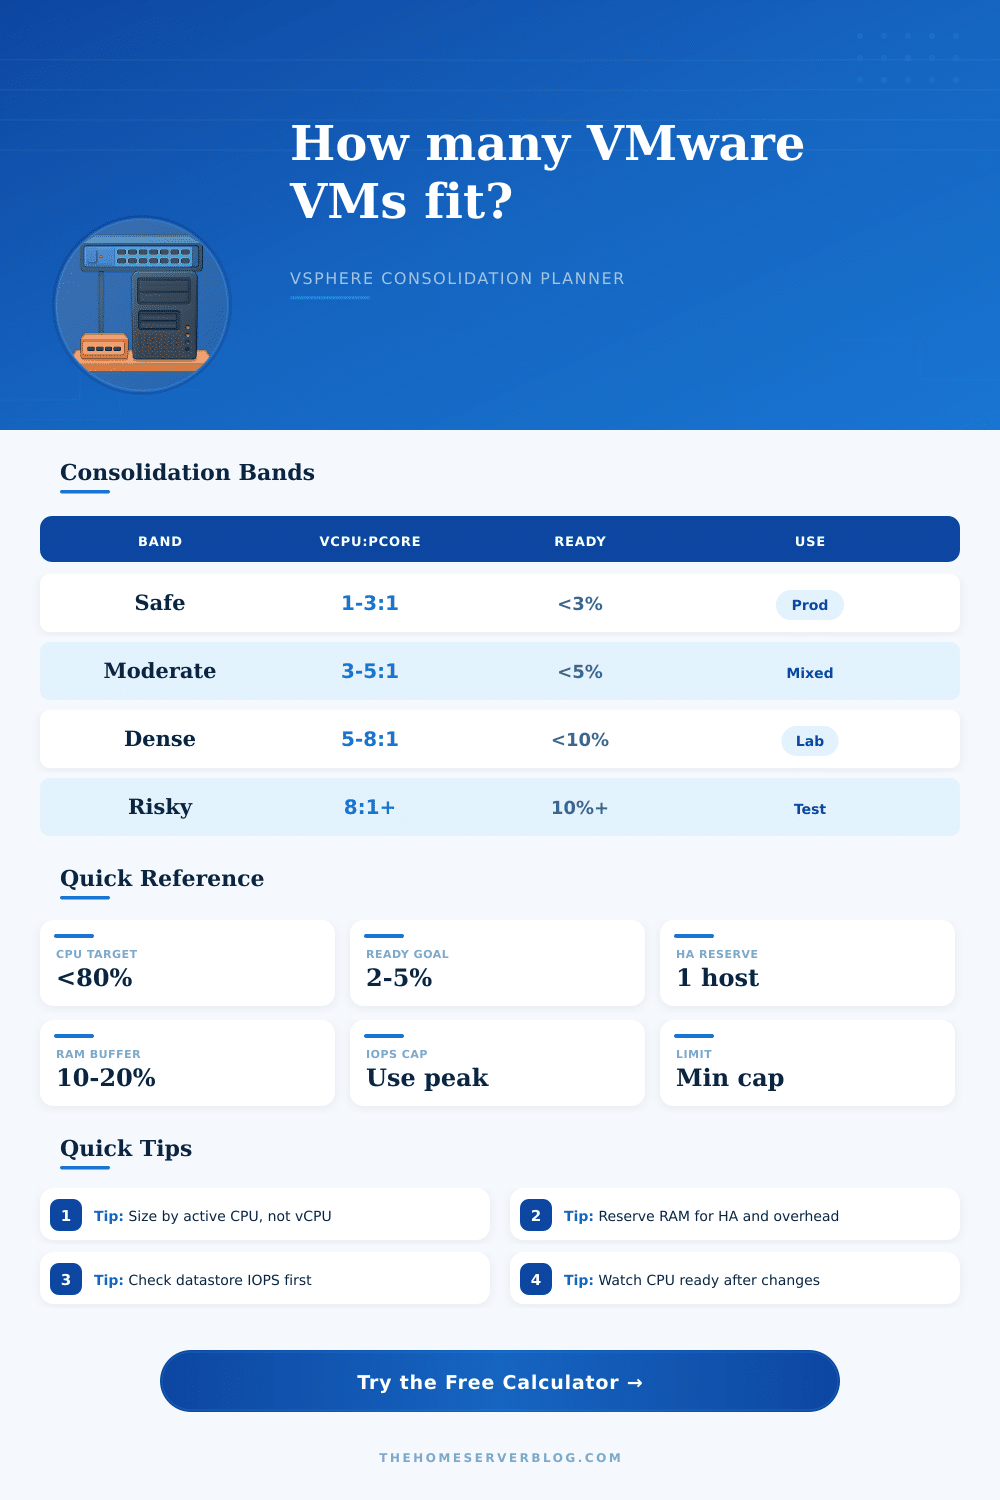
| Workload mix | Common vCPU:pCore | CPU ready target | Memory stance | Practical note |
|---|---|---|---|---|
| Latency-sensitive databases | 1:1 to 2:1 | Under 2% | Reserve most RAM | Avoid large co-stop and noisy neighbors |
| General server VMs | 2:1 to 5:1 | Under 5% | 10-20% overhead | Good default for mixed home services |
| Dev/test and nested labs | 4:1 to 8:1 | Under 10% | Monitor ballooning | Works when workloads are bursty |
| VDI or desktop pools | 3:1 to 6:1 | Under 5% | Plan login storms | Storage latency is often the first limit |
| Appliances and tiny Linux VMs | 5:1 to 10:1 | Under 10% | Small RAM blocks | Great fit for DNS, monitoring, and lab tools |
| Storage profile | Typical VM IOPS | Latency goal | Consolidation impact | Home lab hint |
|---|---|---|---|---|
| Light Linux services | 5-25 | Under 20 ms | CPU or RAM usually limits first | Fine on mirrored SSDs |
| Windows app servers | 25-75 | Under 15 ms | Balanced storage sizing matters | Use datastore latency alarms |
| Database or logging VMs | 100-500+ | Under 10 ms | IOPS can dominate capacity | Separate busy VMDKs if possible |
| VDI desktops | 20-100 | Under 15 ms | Boot and login storms skew averages | Model peak, not idle desktop IOPS |
| Scenario | Hosts | Per-host spec | Typical VM size | Planning focus |
|---|---|---|---|---|
| Single host starter lab | 1 | 8 cores, 64 GB | 2 vCPU, 4 GB | No HA, keep spare RAM |
| Three node mini cluster | 3 | 12 cores, 128 GB | 2 vCPU, 6 GB | N+1 capacity and storage |
| Small business cluster | 4 | 24 cores, 256 GB | 2-4 vCPU, 8 GB | HA admission and ready time |
| Dense nested lab | 2 | 32 cores, 512 GB | 2 vCPU, 8 GB | RAM overhead and IOPS bursts |
It all begins with shiny new server rack and a head full of dreams about running everything in your own data center. The hardware sounds impressive on paper. It has dozens of cores and hundreds of gigabyte of RAM. You want to put as many virtual machines on that piece of metal as physically possible. This is where the consolidation ratio come in, and where most home lab enthusiasts trip up.
I’ve got a calculator for you that will run the math for you, but first we need to step back from spec sheet and understand what those numbers actualy mean. That means looking at how virtualization naturaly behaves under load. This is all just to say: If you don’t consider overhead, then raw hardware capacity are a lie.
How to Use This Calculator
Four vCPUs assigned to a virtual machine isn’t necessarily four full physical cores. It’s permission to consume up to four cores’ worth of processing time. That time will be shared among all the other guest on the same host. If they all pull at once, performance collapse. To avoid that, the tool ask for a percentage of an active CPU per VM. Most people either guess wildly or leave it blank; but it actually does matter. A database index engine is different than a web server that spends most of its days sitting idle. One chews through cycles constantly; the other hardly ever do. Your estimate of what it’s actively using gets fed into the calculator, which tell you how many guests you can put on one host without causing lag spikes for both sleepy and hungry ones.
Memory tells a similar story, but with a higher price tag for mistakes. But this time, your bill is more larger. The number-one thing folks forget about when configuring home labs are overhead… Each VM requires memory not only for its OS, but also for vSphere housekeeping chores. When that twelve percent overhead input is multiplied by twenty virtual machines, that’s a lot of physical capacity that gets eaten up. If neglected, your hosts will start growing too large and switching places, which slow everything down. You’ll turn a fast lab into a sluggish one.
This is all spelled out clearly in reference table on the page. Remember, different workloads require different approaches to memory… Leave extra space for latency-sensitive databases. Dev test box can be more aggressive with sharing, though.
Another level of complication that many CPU and RAM calculators don’t account for are storage. Input-output operations per second is limited for your datastore. So if you cram 50 virtual machines into one NAS drive, the storage queue will back up in no time flat. By requesting average VM usage and what’s the IOPS cap on your datastore, the calculator makes you think about that bottleneck and prevent a situation in which you’ve got more than enough CPU headroom but your application time out due to the disk not keeping up with the requests. It is a little bit of work, but it is a good check when figuring out why a fast server feel slow.
But with High Availability reserves, that changes everything. With a three-host cluster, reserving a host for failover mean you have just two hosts performing constant tasks. If you’re concerned about uptime, that N+1 capacity change isn’t optional, and it cuts your effective density in half, while giving you back your sleepless nights. The tool takes that into account and adjust your overall VM capacity accordingly so you don’t over-provision beyond the cluster’s ability to handle a failure event.
You should of checked this earlier. Ultimately the secret is knowing what these numbers realy mean. High isn’t necessarily bad… A high consolidation ratio won’t cause problems unless it’s accompanied by elevated storage latency or CPU ready time. Run the defaults as a sanity check, and customize the inputs based off your individual workloads. This thing needs to endure during peak periods… Don’t design a system to handle idling web browsers, build it to withstand the storm. Let the calculator do the math, you tell it what lives in those boxes. Knowing where that line exists between raw power and practical headroom is how you’ll stabilize a virtual world over time.