Web Server Capacity Planning Calculator
Estimate how many web servers you need from real workload constraints: peak requests per second, dynamic CPU time, cache hit ratio, worker memory, network egress, database QPS, and deployment headroom.
Capacity Breakdown
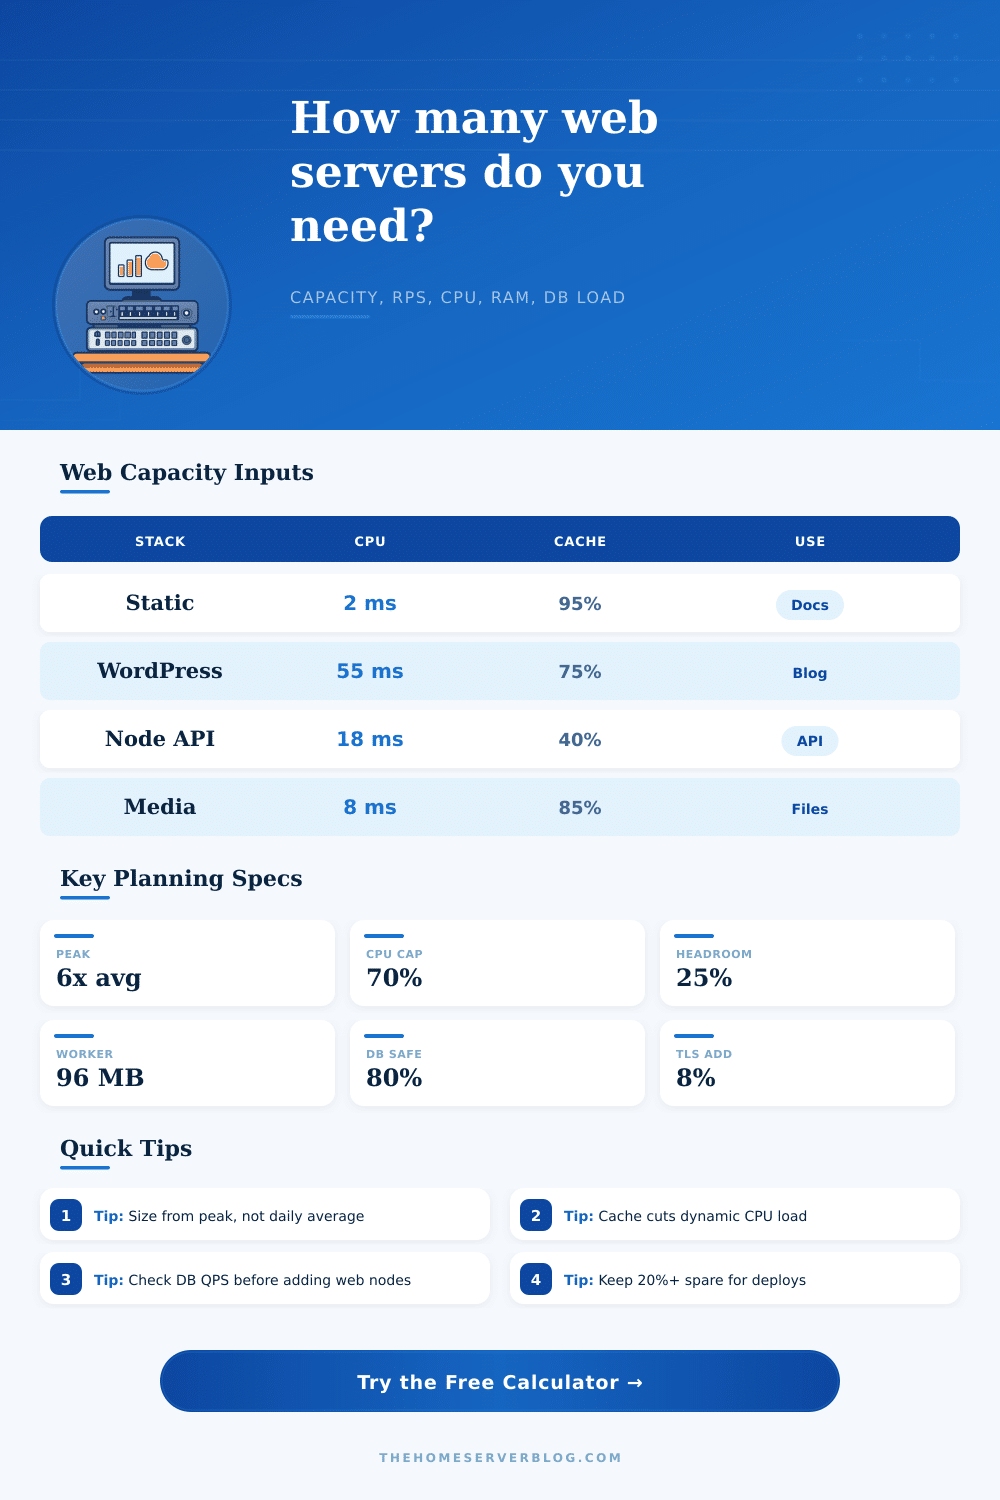
| Workload profile | Starting CPU | Starting cache | Planning behavior |
|---|---|---|---|
| Static site or docs behind CDN | 2 ms/request | 95% | Network and cache freshness often matter more than web CPU. |
| WordPress or PHP CMS | 55 ms/request | 75% | Dynamic misses, PHP workers, object cache, and database QPS set capacity. |
| Node.js JSON API | 18 ms/request | 40% | CPU may be light, but DB QPS and event-loop blocking need watching. |
| Python or Rails application | 85 ms/request | 35% | Worker memory and request hold time often drive node count. |
| Large file or media downloads | 8 ms/request | 85% | Egress Mbps, file cache, and connection time dominate. |
| Constraint | Formula used | What it catches | Action when high |
|---|---|---|---|
| Peak RPS | daily requests / 86400 x peak factor | The real busy-minute load hidden by daily averages | Use access logs or load balancer metrics to refine the peak factor. |
| CPU servers | dynamic RPS x CPU ms / vCPU ms available | Application service-time saturation | Improve cache hit rate, tune code, or add web nodes. |
| Memory workers | dynamic concurrency / workers per server | PHP-FPM, Puma, Gunicorn, or container memory pressure | Reduce per-worker memory or increase RAM before raising worker count. |
| Network servers | peak Mbps / usable Mbps per node | Static assets, media delivery, and slow client egress | Move assets to CDN or raise per-node network class. |
| Database load | dynamic RPS x queries per request | Back-end bottlenecks that extra web servers cannot fix | Add query cache, indexes, read replicas, or reduce dynamic misses. |
| Server class | Typical vCPU/RAM | Good for | Capacity planning note |
|---|---|---|---|
| Small VM | 2 vCPU / 4 GB | Reverse proxy, small CMS, internal tools | Often memory-limited if app workers are heavy. |
| General VM | 4 vCPU / 8 GB | Most blogs, APIs, and home lab public services | Good default for balanced CPU and worker memory. |
| Compute VM | 8 vCPU / 16 GB | Dynamic apps, SSR, heavy PHP, larger APIs | Use when CPU ms per request is well measured. |
| Memory VM | 8 vCPU / 32 GB | Many workers, large runtimes, report pages | Useful when concurrency drives memory before CPU saturation. |
| Edge cache node | 4 vCPU / 16 GB | Nginx cache, download proxy, image cache | Disk and network may be more important than app CPU. |
| Project pattern | Traffic shape | Primary limiter | What to validate |
|---|---|---|---|
| Personal home lab dashboard | Low RPS, high trust, small bursts | Redundancy rather than raw throughput | Backups, monitoring, and one-node failure recovery. |
| Public technical blog | Search spikes and social bursts | Cache misses and database reads | Full-page cache hit rate and slow query log. |
| Product launch landing page | Very high peak-to-average factor | Network and CDN cache behavior | Origin shielding and cache-control headers. |
| Authenticated SaaS dashboard | Steady workday peaks | Dynamic CPU, workers, and DB QPS | Load-test authenticated flows, not only static pages. |
| Download mirror | Long transfers and slow clients | Egress Mbps and connection occupancy | Provider bandwidth caps and file cache hit rate. |
This calculator is a planning model, not a replacement for a load test. Validate final numbers with production-like traffic, representative cached and uncached paths, TLS enabled, logging enabled, and realistic database latency.
Web server capacity planning are a process of determining how many resource are required to handle the traffic that reaches the web servers. While many people feel that planning the resources required for a web server is a simple task, web server capacity planning can become difficult if there are traffic spike for the websites. These traffic spikes can happen due to sending a newsletter to the users of the website or launching a new product on the website.
During these times, the servers must be able to handle the traffic that arrives during the busiest minute for the website. The traffic must be considered for how much of that traffic reaches the application itself instead of the cache that may be in place to handle those requests. Furthermore, the database for that application must be able to handle the traffic if the cache isnt able to fulfill the requests of those visiting the website.
Plan Web Servers for Peak Traffic
The average traffic for a website is not the same than the traffic that the website will get during its peak load minutes. Due to the fact that traffic does not even out across the 24 hour period, there may be traffic spikes during specific hour of the day. During these peak minutes, a website may receive three to eight times as much traffic as it recieve on average.
During these peak times, the traffic may be even higher if the company is having a promotion for one of its products. A calculator can help to determine the rate at which the servers for a website must be able to handle the traffic during these peak load times. This rate in number of requests per second is a target that will help the web administrator with the remainder of the web server capacity planning tasks.
The hit rates for the website cache will impact the traffic that falls on the web servers for the website. High hit rates for cache mean that most of the traffic does not ever reach the web servers or the database. Low hit rates mean that each additional visitor to the website place more work on the web servers and the database.
Because low hit rates increase the work that the web servers must perform, changing the percentage value of the cache in the calculator may significantly change the number of web servers that is recommended for the website. Thus, the cache acts as a line of defense for the web servers and the database. Another factor that must be considered for web server capacity planning is the CPU time that will be required for each dynamic request of the website.
Some pages on a website may require less CPU time than others. Pages that require a search function or some other type of dynamic content may require more CPU time than static pages. Because there is a limited amount of CPU time for each web server each second, the more CPU time required for each dynamic request of a website means that there will be a higher number of web servers that is required to handle that traffic.
Another factor for determining the number of web servers that is required for a website is the memory and the number of workers for the website. Each request that a web server handles will use a worker process or thread for the length of the request. Furthermore, if the workers are kept in memory, then the amount of RAM that is available to the website can limit the number of requests that are made to the website.
The available RAM for the website can be calculated by taking the total amount of RAM for the server and subtracting the amount of RAM that the operating system and other services take. The available RAM can then be compared to the concurrency of requests for the website. Another constraint for web server capacity is the network capacity for the website.
The websites with small JSON responses will not reach the network capacity limits. However, a website with many images or large downloads can reach the network bandwidth limits. Furthermore, if the network is saturated, it will create a bottleneck in the network that will impact the performance of the web servers more highly than the CPU will impact the website’s performance.
Thus, the response size for a website should be included in the calculations for peak bandwidth in order to determine whether the network or the web servers will be the limiting factor in the performance of the website. Another separate factor that must be considered is the load for the website’s database. Even if the web servers are able to handle the traffic for the website, if the database is overloaded, then the website will suffer.
Furthermore, adding more web servers will not help in this situation. The load on the database can be calculated by multiplying the number of dynamic requests per second for the website by the number of database queries that each request performs. If the number of dynamic requests per second for the website is too high, steps will have to be taken to either improve the caching for the database or to reduce the number of queries that the website performs.
According to the deployment goals for a website, it is required to have more web servers than just those that are calculated for the minimum requirement. The number of web servers will have to include servers for draining a server during a rolling update of the website. Additional web servers will be required to ensure that if one web server fails, the remaining web servers can handle the traffic.
Additional web servers will be required to account for the potential loss of those web servers if the cache for the website is flushed. Thus, it is not necessary for the website to have web servers calculated to exactly meet the minimum calculated for the website. The number of web servers that will be deployed for the website can be calculated using a tool that calculates the operational floor for the website based on its deployment goals.
All of the constraints that is placed on a website will interact with one another. For instance, increasing the hit rate for the cache will decrease the CPU needs of the web servers. Furthermore, decreasing the CPU needs of the web servers will decrease the memory needs for the web servers to operate.
Thus, if the memory is the new limiting factor for a website, that indicates which part of the website will need additional attention from the website administrators. Finally, the calculations and considerations for web server capacity may need to be tested with load testing. Load testing will allow an administrator to simulate the traffic that is expected to reach the web servers.
Furthermore, testing with real traffic will allow the administrator to see if any changes are needed to the settings and algorithms for the calculations for web server capacity. While the calculator for web server capacity is a great starting point for web administrators for calculating the number of web servers that are required for a website, the actual performance of the servers during expected traffic will be needed for validation of the calculations.