LoRa Link Budget Calculator
Estimate LoRa RSSI, sensitivity, fade margin, EIRP compliance, maximum range, and packet airtime for gateway, sensor, and home lab telemetry links.
Formula Breakdown
| Spreading factor | Required SNR | 125 kHz sensitivity estimate | Planning tradeoff |
|---|---|---|---|
| SF7 | -7.5 dB | About -124 dBm with 6 dB NF and 2 dB implementation loss | Lowest airtime, best for strong links and dense gateway coverage. |
| SF8 | -10 dB | About -127 dBm | Moderate range increase without the airtime penalty of SF10-SF12. |
| SF9 | -12.5 dB | About -129 dBm | Common balance point for home sensors, sheds, and nearby outbuildings. |
| SF10 | -15 dB | About -132 dBm | Useful for rural nodes when payloads stay short and infrequent. |
| SF11 | -17.5 dB | About -134 dBm | Long range with heavy airtime; avoid frequent transmissions. |
| SF12 | -20 dB | About -137 dBm | Maximum sensitivity, slowest rate, and highest collision risk. |
| Region profile | Nominal band | Typical LoRaWAN uplink BW | Common EIRP planning limit |
|---|---|---|---|
| US915 | 902-928 MHz | 125 kHz channels plus 500 kHz uplinks | 30 dBm EIRP planning cap for many deployments. |
| EU868 | 863-870 MHz | 125 kHz uplinks | 14 dBm EIRP and duty-cycle limits are common constraints. |
| AU915 | 915-928 MHz | 125 kHz channels plus 500 kHz uplinks | 30 dBm EIRP planning value for high-power modules. |
| AS923 | 920-925 MHz class | 125 kHz uplinks | 16 dBm EIRP is a conservative default in many plans. |
| IN865 | 865-867 MHz | 125 kHz uplinks | 30 dBm EIRP planning value, with local channel rules checked separately. |
| Antenna or cable choice | Typical gain or loss | Best LoRa use | Calculator note |
|---|---|---|---|
| PCB trace antenna | -2 to 0 dBi | Indoor sensor board or small enclosure | Enter negative gain when the board is inside a plastic or metal-adjacent case. |
| Quarter-wave whip | 1.5 to 2.5 dBi | General home sensor and dev board nodes | Most starter LoRa nodes match this default. |
| Outdoor fiberglass omni | 5 to 8 dBi | Roof gateway, barn gateway, or relay point | Higher gain helps link budget but narrows vertical coverage. |
| Short RG-58 pigtail | 0.5 to 1.5 dB | Small enclosure to bulkhead connector | Count every adapter, surge protector, and pigtail. |
| LMR-400 class feedline | About 0.04 dB per meter at 900 MHz | Longer gateway mast runs | Good cable can recover several dB compared with thin coax. |
| Project scenario | Typical distance | Common radio settings | Healthy design target |
|---|---|---|---|
| Basement utility sensor to attic gateway | 15-40 m through floors | SF8-SF9, 125 kHz, 14-20 dBm | 15 dB fade margin after wall loss and seasonal clutter. |
| Mailbox or gate contact to house | 50-250 m outdoors | SF7-SF9, 125 kHz, whip antennas | 10-15 dB margin if the path stays above cars and shrubs. |
| Barn freezer or pump monitor | 0.5-2 km mixed rural | SF9-SF10, raised gateway antenna | 15-20 dB margin for wet foliage and wall penetration. |
| Remote soil probe across a field | 2-8 km line of sight | SF10-SF12, outdoor antennas | 20 dB margin plus EIRP check before raising TX power. |
When you want to determine whether the signal from your small sensors will be strong enough to be useful at the receiver, you must determine whether the signal has enough strength when it arrives at the receiver. LoRa technology enable communications over long distances, but the technology only works if the signal stays within the available margin for the signal. The link budget is the method of calculating the available margin for the signal.
You begin with the power of the radio that can be pushed out. You add the gain from the antenna. You subtract the loss of the signal due to the cables, connections, and the walls between the sensor and the gateway.
How to check the LoRa link budget
Finally, you compare the results to the sensitivity of the receiver. If the results are much more higher than the sensitivity limit, the link will work. However, if the results are close to or lower than the sensitivity limit, you must change a variable within the system prior to installing the components.
There are many variable that can impact the link budget. Some variables are specific to the projects. For example, the transmitter power and the antenna height is important variables.
However, the loss of the signal on the cables between the sensor and the gateway is another important variable that engineers often dont account for in their designs. The spreading factor of the signal is another variable that impacts the link budget. A spreading factor of SF12 creates more sensitivity in the signal so that buried sensor nodes remains connected to the network.
However, using a spreading factor of SF12 also makes each data packet take ten times as long to be transmitted as if a faster spreading factor was used. Other variables that impact the link budget include the bandwidth of the signal and the coding rate of the signal. These two variables will impact both the range and airtime of the signal.
Therefore, it is important to ensure that the signal is configured to the fastest setting possible that will still allow the link between sensor and gateway to be established. Finally, there are also environmental variables that may impact the signal strength between the sensor and the gateway. Such environmental variables may include the terrain between the two components and the number of buildings whose walls the signal must pass through.
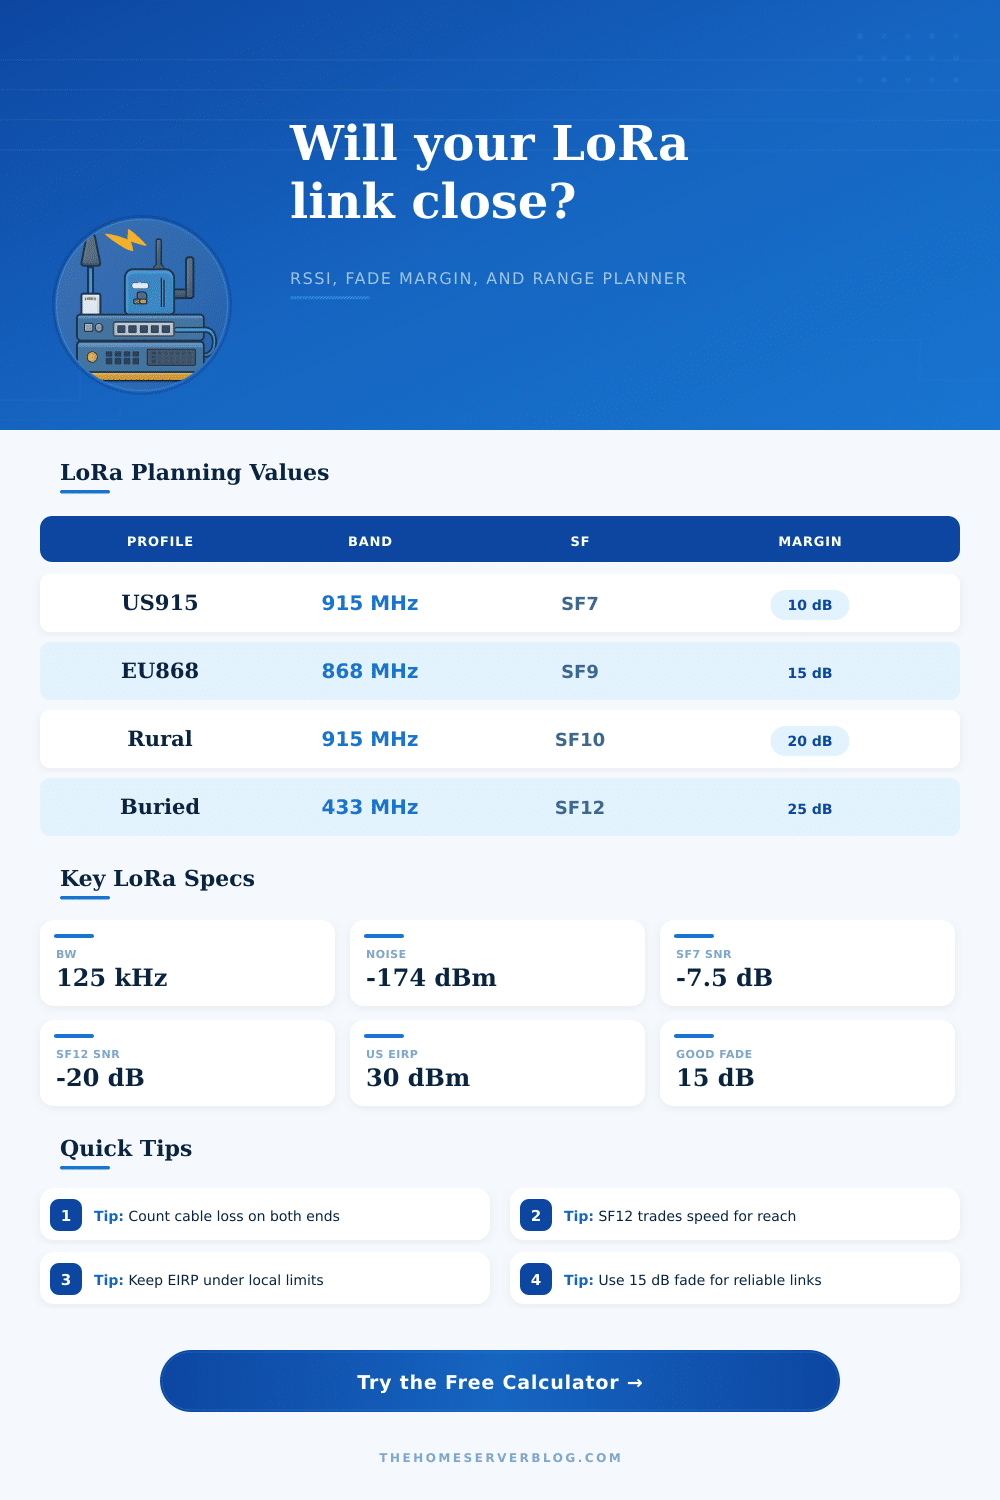
These variables must be accounted for in the link budget calculation by using an environment settings in a link budget calculator. Furthermore, because weather, foliage, and movement of the gateway antennas will impact the signal after installation of the hardware, a fade margin must also be included in the link budget calculations. A target fade margin of fifteen decibels is common for homes that are installing these sensor networks to provide for the room for environmental variables to be accounted for in the link budget.
The sensitivity of a LoRa signal is based on the spreading factor, the bandwidth, and the noise figure of the radio. A higher spreading factor means that a lower signal-to-noise ratio is required to maintain the same data rate. That’s why a higher spreading factor allows a signal to travel farther.
However, a higher spreading factor uses more airtime to transmit the signal. The greater the airtime, the higher the chance of collision between signals in a busy network. Devices have local duty cycle limits on how often they may transmit signals; using up too much airtime may result in throttling of the signal.
Using a calculator will allow you to see the airtime that a signal will use so that you can determine a suitable balance between signal sensitivity and airtime before you mount the antennas to the hardware. To determine if the system complies with EIRP limits, you have to calculate the EIRP of the system. To do so, you take the conducted power of the radio, add the antenna gain, and subtract the transmit-side losses.
The resulting number must not exceed the regional EIRP limit. Using the wrong antenna, for example, may result in the EIRP of the radio system exceeding the regional limit even if you set the radio power to a low number. Checking the EIRP value will allow you to avoid problems with the regulatory authority and avoid having to reduce the transmit power of the radio later on.
Many people make mistakes when they calculate the link budget of a LoRa system. One of the most common mistakes is forgetting to subtract the loss of signal power caused by the pigtails and lightning arrestors when adding the antenna gain to the conducted power of the radio. Another mistake is picking the highest spreading factor for the radio to maximize the distance over which the signal can travel.
The downside of using the highest spreading factor is that the battery life will decrease because of the airtime used to transmit the signal. Finally, many people will find that the link is successful when they first deploy the LoRa system but may fail later on in the day due to the lack of margin to account for difference in signal strength between a dry day and a wet day. Reference tables can show you how the sensitivity of the signal changes with different spreading factors and how the different regions have set the power limits for LoRa signals.
These tables can allow you to quickly check your calculations. The results of your calculations will show you the margin that the link will have; you have to decide whether this is sufficient, or whether you need to increase the height of the antenna mast or the quality of the transmission cable. A reliable LoRa link is one that allows for sufficient headroom for variables that are not accounted for in the product datasheet.
A link budget calculator will allow you to make such tradeoffs prior to mounting the antennas to the hardware.