Web Server Sizing Calculator
Estimate vCPU, memory, worker processes, bandwidth, log storage, and node count from traffic peaks, cache behavior, dynamic request cost, TLS overhead, and availability targets.
Capacity Breakdown
| Workload pattern | Typical cache hit | CPU driver | Primary sizing risk |
|---|---|---|---|
| Static site or generated blog | 90% to 99% | TLS, compression, logging | Underestimating asset egress from origin when CDN is bypassed |
| WordPress with page cache | 60% to 95% | PHP misses, admin traffic, search | Too many PHP-FPM workers can exhaust RAM before CPU is full |
| SSR JavaScript dashboard | 20% to 70% | Rendering and API aggregation | CPU spikes from server rendering during login or refresh storms |
| API gateway or JSON service | 0% to 50% | Upstream latency and serialization | Concurrency grows when dependencies slow down |
| Monolith with background admin use | 10% to 60% | Database wait plus app CPU | Memory pressure from large process pools and report endpoints |
| Rule of thumb | Formula | Calculator use | Practical limit |
|---|---|---|---|
| CPU cores | dynamic RPS x CPU ms / 1000 | Converts request service time into busy cores | Keep sustained utilization below about 65% to 75% |
| Workers | ceil(inflight / per-worker concurrency) | Sizes PHP-FPM, app workers, or safe async pools | Worker count is bounded by memory before CPU on many stacks |
| Bandwidth | RPS x KB x 8 | Estimates peak origin Mbps and monthly GB transfer | Use measured compressed bytes when possible |
| Log storage | requests x bytes x retention | Plans local access and app log retention space | Structured JSON logs can be much larger than common logs |
| HA nodes | capacity / active nodes | Spreads CPU and RAM across the selected topology | Each node should tolerate one peer down for production HA |
| Server profile | Starting point | Memory notes | Good first test |
|---|---|---|---|
| Small cached WordPress | 2 vCPU, 4 GB RAM | Limit PHP workers, reserve page cache | Load test uncached homepage and wp-admin separately |
| Moderate dynamic CMS | 4 vCPU, 8 GB RAM | Monitor PHP RSS, Redis, and OPcache hit rate | Test cache warm and cache cold traffic mixes |
| API or SSR app | 4 to 8 vCPU, 8 to 16 GB RAM | Watch event loop lag, heap, and upstream wait | Simulate dependency latency, not only happy-path replies |
| High availability web tier | 2+ nodes | Per-node reserve must survive one node offline | Drain a node during peak test and confirm response times |
| Metric to watch | Healthy range | Warning sign | Likely fix |
|---|---|---|---|
| CPU steal and load | Low steal, load near cores | High steal or run queue growth | Move host class, add cores, reduce noisy neighbors |
| Memory available | Enough for workers and page cache | Swap activity or OOM kills | Lower workers, add RAM, move services away |
| P95 response time | Stable under peak | Climbs faster than RPS | Profile slow routes, cache hot paths, add workers carefully |
| Origin egress | Below NIC and provider cap | Large uncached assets from origin | Increase CDN cache hit, compress, move media storage |
This calculator estimates the web tier only. Database servers, object storage, queues, search, CDN rules, and external API latency should be modeled separately for production architecture.
Selecting the correct size for a web server is a necessary task to ensure that the server isnt too small to handle the traffic that comes to that web server. The web server must be able to handle the amount of traffic that comes to that server. The amount of traffic that come to a web server is not even close to even averages each month.
Each request that comes to a web server can take a different amount of cost to handle. Therefore, to determine the size of a web server, you must calculate the traffic to that server. The calculator will provide mathematical results after you enter the number of visits that your web server will receive each month or the number of requests that will come in each second at peak times for your web server.
How to Pick the Right Web Server Size
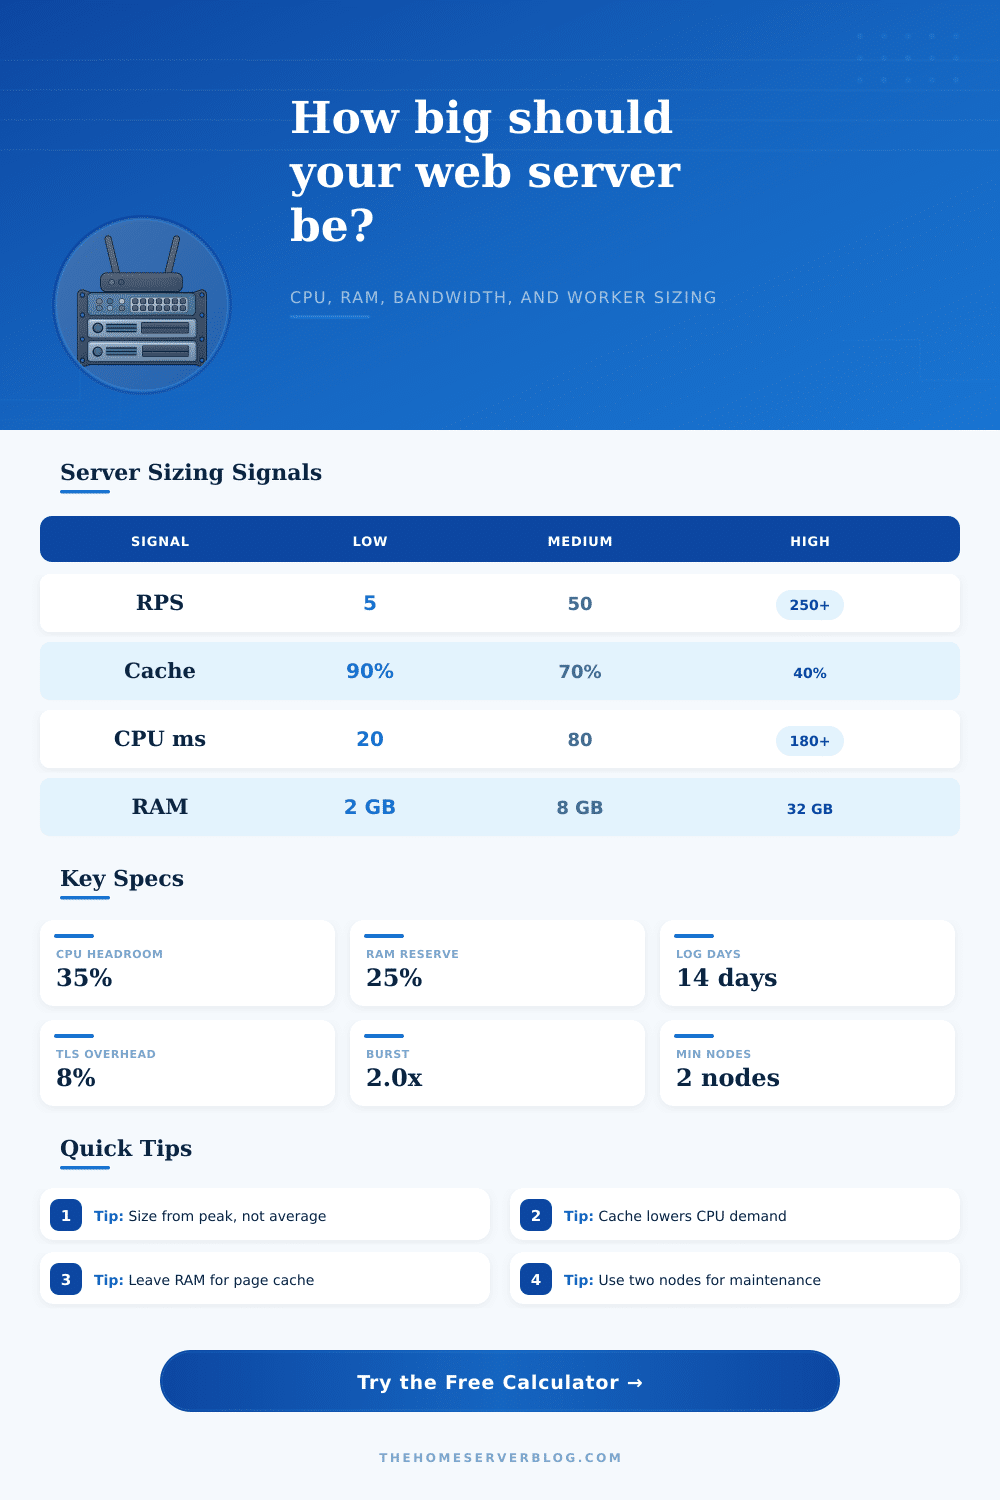
The calculator determines how many requests will come to your web server after your cache filter the requests. Your web server will also determine how many milliseconds of CPU each request will consume. The calculator will determine how many concurrent requests a single worker process can handle before it becomes memory pressured.
The calculator will not provide a number for the size of your web server, but it will provide recommendations for the vCPU, RAM, the number of workers, the bandwidth that your server will require, and the minimum number of nodes that your web server should have. The cache hit rate will be an important input in the calculation of the resources that your web server will require. If the cache hit rate is high, then the number of requests that will reach your web server will be low.
If the cache hit rate is high, then your CPU and the number of workers will be low. If the cache hit rate is low, then all requests will reach your web server as it must perform database task for each request. The low cache hit rate means that your web server will require more CPU and memory resources to handle these requests.
The cache hit rate will allow the calculator to dynamically adjust the number of requests that are made to your web server. Additionally, the calculator will also include a factor that accounts for the overhead of using TLS to encrypt data between your server and your clients. Worker memory and concurrency are two important factors in the functioning of your web server.
Each worker process will require a certain amount of RAM to function. If the number of workers that are allowed to run at one time is too high for the amount of RAM that is installed on the server, the operating system will begin to evict the page cache from RAM to memory for those workers. This will make the web server seem slowly to the clients.
The concurrency for a worker process determines the number of requests that can come to that worker process without the response time for the web server decreasing. This setting will allow the calculator to determine the number of worker processes that are required to handle the estimated number of requests that will come to your web server each month. The number of nodes and whether you want to use redundancy for your web server will change the recommendations for your web server.
A single node is suitable for small web servers for noncritical applications. For production environments, at least two nodes are recommended so in case one node fails, the other can carry the traffic for your web server. The higher the availability that you want for your web server, the more nodes you will have to spread your total web server capacity.
Additionally, the percentage of the total server capacity that you want to use as a buffer for traffic bursts will add protection to your web server in case of a sudden purge of the cache that increases the work load on your origin web server. The reference tables will show you the type of traffic that your web server will receive. For static websites, the main limiting factor will be the egress bandwidth and the number of TLS operation that are performed.
For dynamic content management systems, the memory will be reached before the CPU is reached because the number of worker processes for dynamic content management systems can grow quick. The calculator will provide you with a hypothesis about the size of your web server, but it is not capable of accounting for all the ways that traffic to your web server may deviate from the initial estimates. Traffic to a web server can include background jobs, admin traffic, search engine crawlers, and traffic from marketing campaigns.
You should always load test your web server with the size calculations from the calculator to ensure that your configuration matches the estimate. Monitoring the memory and response time of your server will help to fine tune the number of worker processes that you allow to run. The purpose of this calculator will help you understand the traffic to your web server and the cost of each request.
By understanding the cost of each request to your web server, you can make informed decisions about server configurations. By understanding the cost of each request, you can see how adding more cache will reduce the cost of that request to your web server. You can also see how increasing the concurrency limit for a blocking stack will increase the demand on the memory of your web server.
Finally, understanding the availability of your web server will help you to understand how many machine your web server will require to handle the traffic effectively.