Availability Calculator
Model home server uptime from MTBF, MTTR, redundancy, maintenance windows, monitoring delay, power protection, and dependency risk so you can compare realistic service availability targets.
Sets practical interpretation for monitoring, failover, and user impact.
The calculator applies series, parallel, or quorum availability logic.
Servers, VMs, appliances, containers, or replicas that can serve traffic.
For quorum or capacity-sensitive services, set the minimum working nodes.
Average time between unplanned failures per node or service component.
Hands-on recovery time after detection, including reboot or replacement.
Monitoring interval, notification delay, and time before anyone responds.
Service interruption caused by promotion, DNS, VIP, or client reconnect.
Patch windows, firmware updates, UPS battery tests, or storage work.
Use zero if maintenance is rolling and invisible to users.
Power, ISP, switch, storage pool, DNS, or another required dependency.
Percentage of short power or reboot events absorbed without outage.
Minutes between health checks, probes, or synthetic user tests.
Extra downtime allowance for imperfect estimates and manual procedures.
Availability Breakdown
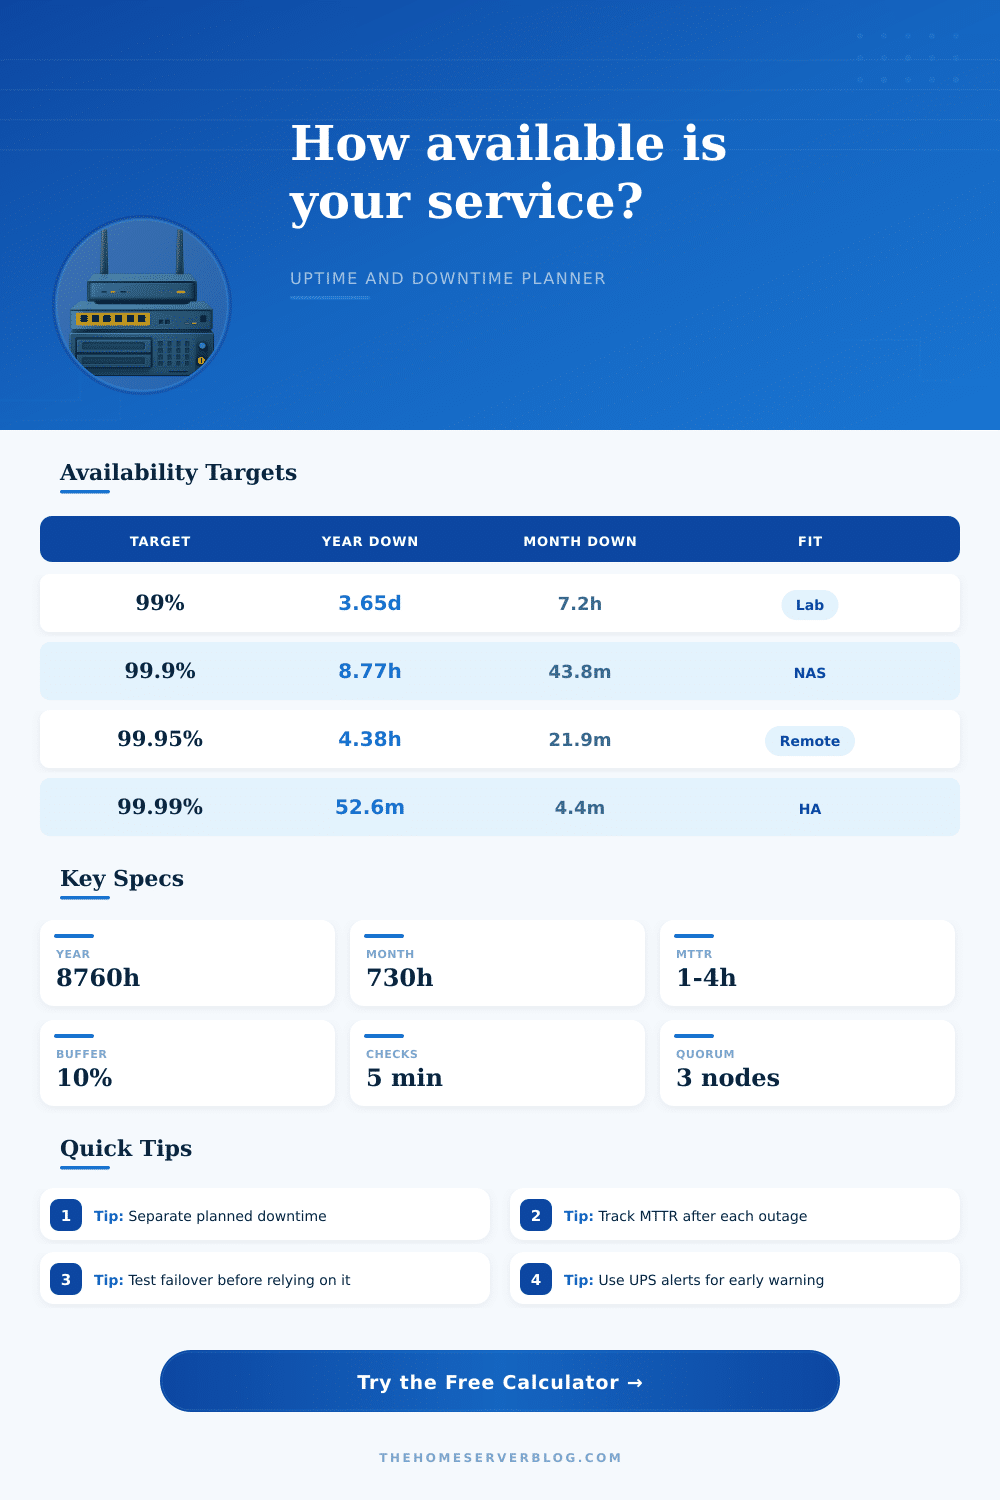
| Target | Downtime Per Year | Downtime Per Month | Home Server Fit |
|---|---|---|---|
| 99% | 3.65 days | 7.30 hours | Acceptable for experiments, test VMs, and noncritical lab apps. |
| 99.5% | 1.83 days | 3.65 hours | Useful for hobby media servers and local-only services. |
| 99.9% | 8.77 hours | 43.8 minutes | Good target for NAS access, Home Assistant, DNS, and VPN. |
| 99.95% | 4.38 hours | 21.9 minutes | Reasonable for services used by family members away from home. |
| 99.99% | 52.6 minutes | 4.38 minutes | Requires redundancy, monitoring, failover practice, and stable dependencies. |
| Architecture | Calculator Logic | Best Use | Main Risk |
|---|---|---|---|
| Single node | One node availability multiplied by dependency uptime. | NAS shares, hobby apps, single mini PC services. | Every reboot, disk issue, and OS fault is visible. |
| Warm standby | Parallel node math with added failover interruption. | Spare VM host, manual DNS switch, standby appliance. | Standby may drift unless updates and restores are tested. |
| Active-passive | Parallel availability with shorter failover penalty. | HAProxy, keepalived, replicated databases, paired gateways. | Shared storage, split brain, and failback process errors. |
| Active-active | At least one node online, adjusted for required nodes. | DNS, web front ends, stateless containers, load-balanced services. | Capacity can be degraded even when service remains up. |
| 3-node quorum | Binomial probability of required nodes online. | Proxmox, Ceph monitors, etcd, clustered control planes. | Quorum device, network, and storage latency can dominate uptime. |
| Component | Typical MTBF Input | Typical MTTR Input | Calculation Note |
|---|---|---|---|
| Containerized app | 250 to 1000 hours | 0.1 to 1 hour | Fast restarts help only when storage and dependencies stay healthy. |
| Single home server | 500 to 2000 hours | 1 to 6 hours | Patch cadence, firmware, and parts availability shape real recovery time. |
| ISP connection | 1000 to 4000 hours | 1 to 12 hours | Use dependency availability if the ISP is outside your repair control. |
| UPS-backed power | 1000 to 5000 hours | 0.25 to 4 hours | Runtime, battery age, and automatic shutdown decide outage visibility. |
| Cluster node | 1000 to 3000 hours | 0.5 to 3 hours | Cluster availability improves only when failures are independent enough. |
| Project | Suggested Pattern | Target Range | Operational Check |
|---|---|---|---|
| Home Assistant | VM with snapshots, UPS, and tested restore | 99.5% to 99.9% | Confirm automations recover after host reboot. |
| Family NAS | Single NAS plus monitored backups and spare disk | 99% to 99.9% | Separate data durability from service availability. |
| VPN gateway | Active-passive pair or router fallback | 99.9% to 99.95% | Test remote access from outside before travel. |
| Public blog | VPS, external DNS, backups, uptime checks | 99.9% to 99.99% | Measure provider and DNS downtime as dependencies. |
| Proxmox cluster | 3 nodes, quorum, UPS, shared or replicated storage | 99.9% to 99.99% | Practice node maintenance without losing quorum. |
Most people only notice a home server when the home server stop working. A home server may stop working if the Plex media library will not stream to the media client, or if the Home Assistant instance will not answer automation request, or if the home network is locked out of the VPN. Each of these scenario is a question of availability.
Availability relate to how often a system fails, and how quickly the system can recover from that failure. Availability isnt a single number, but rather a calculation of the relationship between the mean time between failures of a system and the mean time to repair the system after those failures. You can enter each of these values into an availability calculator to determine the availability percentage of a system, along with the monitoring, failover, and maintenance schedule of the system.
How to Measure and Improve Home Server Uptime
Availability of a single node without redundancy relate to the failure of that single node. Each component of the node can potentially fail: the hard drive, power supplies, and memory, for example. Additionally, the recovery time to repair those failures can take hours or even days to complete.
The detection delay for recognizing those failing component is one of the most important values to enter into the availability calculator for this reason: if the system only detect potential failures every thirty minutes, then the system has introduced thirty minutes of unavailable time before it begin to repair the system. If the system include redundancy of its components, but the components are not independent of one another, then the same failure that impact one component will also impact the redundant component. For example, if two identical server machine are connected to the same power circuit, then both machine may fail simultaneously due to a power issue.
Availability calculators account for different architecture of redundant networks. For example, if a network is configured as a three-node cluster, one of the nodes can fail without impacting the availability of the network to its user. However, if the network should experience a partition that impact two of the three nodes at once, the partition impacts the availability of the network to its users.
Planned maintenance of network components introduce another source of potential downtime to the system. For example, if a network administrator plan for twelve maintenance window a year for a system, each of those maintenance windows will impact the availability of the system for the users that expect it to be always available. Some network architectures permit rolling maintenance update to the individual nodes of the network without taking the entire network offline.
Other architecture may require maintenance windows to take the system offline entirely. Another consideration for availability is the dependency of the system. The availability of a network, for example, may rely upon the availability of a third-party ISP.
If the ISP should experience an outage, the network will not be available to its users. The availability of those dependency can be entered into an availability calculator. For example, if the networks UPS is only available to provide power for seventy percent of power failure in the area, then the network will experience downtime for thirty percent of power failures.
These percentage each have an impact on the calculated availability of the network. The reference table associated with availability calculators indicate the length of time that a given percentage availability allow the system to be unavailable each year. For instance, availability of 99.9% allows a system to experience nearly nine hour of downtime each year.
However, increasing availability to 99.99% will reduce the amount of downtime to under one hour each year. Higher availability require not just higher costs for additional hardware, but also an understanding that higher availability requires faster detection of problem, tested failover procedure, and an understanding of the availability of the systems dependencies. Another concept related to availability is the idea of an error budget.
Once you establish a target availability percentage for a system, the remainder of the availability percentage represent the error budget for the system. If the system have spent most of that error budget on planned maintenance and slow recovery time for outages, then the system cant afford to experience any additional outage without missing the availability target for that year. Those who is interested in achieving higher availability percentage without consideration of the number of outage that actualy occur with the system often miss this concept.
The value of modeling availability for a system is not in the availability percentage itself, but in the understanding that separates the control that an organization has over availability from the elements of availability that they do not control. Each time that a system experience an outage, those parameter can be adjusted to more accurately reflect availability of the system. For example, if you adjust a parameter for the mean time to repair after the occurrence of an outage, the availability model become a record of the availability of that system.
You can then use this record to determine, for example, if another node is worth the cost of implementation, if the monitoring interval should of been adjusted, or if the cost of implement power protection for the servers is justifiable.