Azure Composite SLA Calculator
Estimate composite uptime and downtime for Azure workloads with serial dependencies, parallel instances, availability zones, paired-region failover coverage, and planned exclusions.
📌Azure architecture presets
⚙Architecture inputs
📊Composite uptime and downtime
🖧Azure SLA architecture grid
📘Composite SLA reference tables
| Architecture pattern | Dependency shape | Sample calculation | Design note |
|---|
| Azure component default | Common SLA input | Where it fits | What to verify |
|---|
| Availability | Downtime per month | Downtime per year | Common name |
|---|
| Preset | Compute mode | Paired coverage | Best use |
|---|
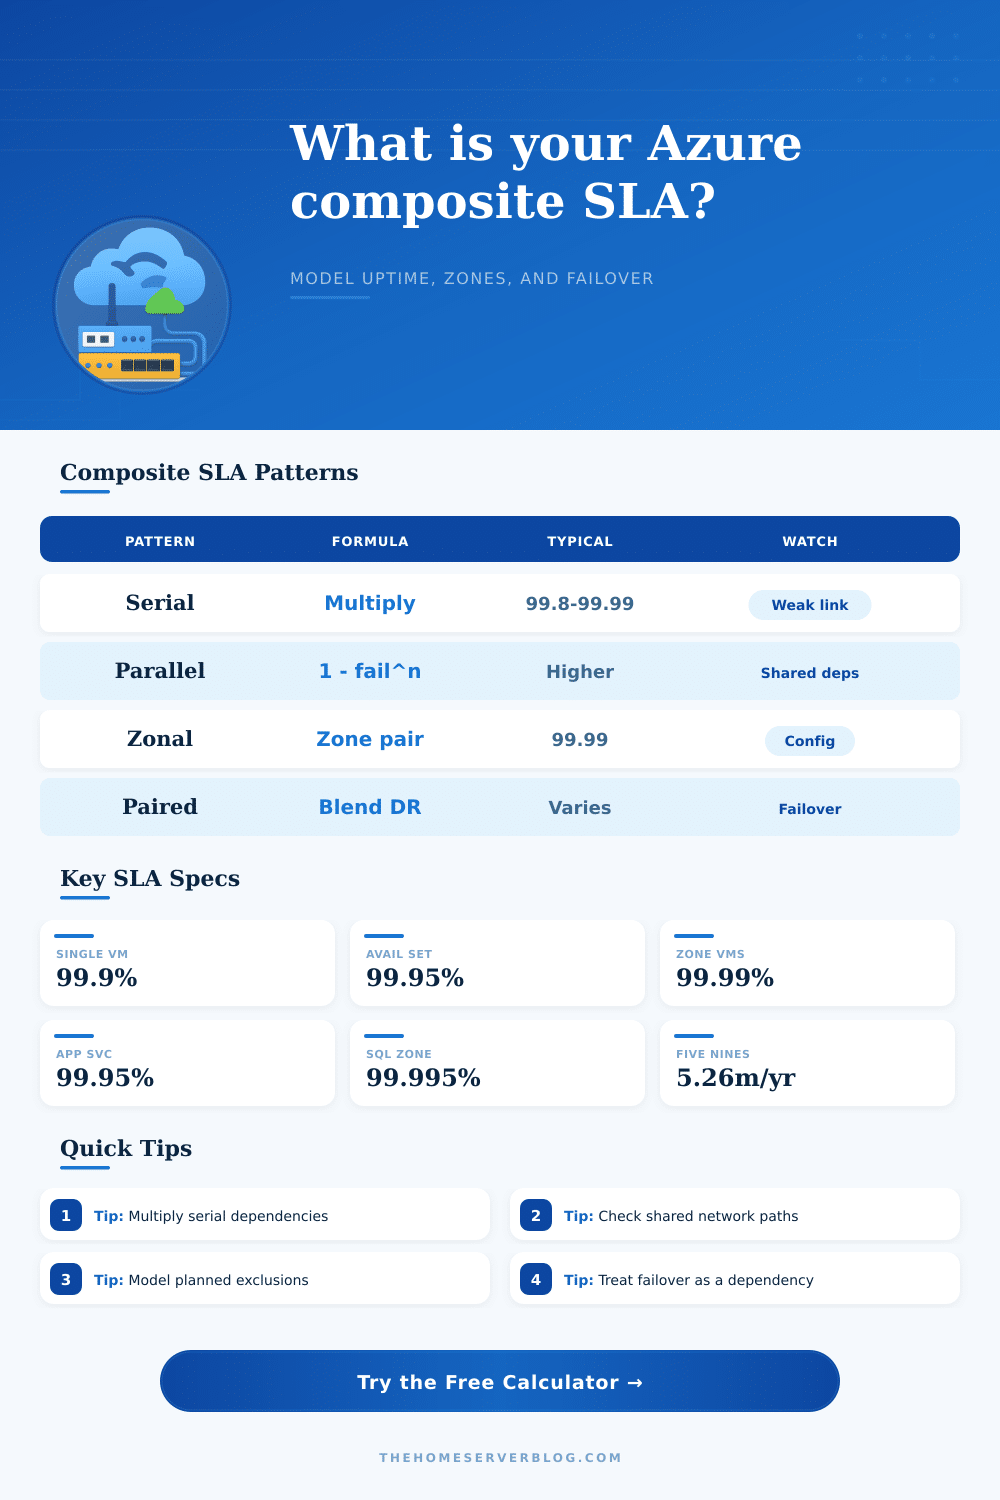
When you run an application on Azure, the uptime that your application experiences is dependent upon the connection of every component of that application to every other component of that application. Each component of the application might have an individual high SLA for the web tier, for example, but the uptime of the entire application is the composite SLA of all of those components. Determining how each component of the application is connect to the next component of that application calculates the composite SLA.
For instance, if the web tier has an SLA of three nines and the database has an SLA of four nines, the uptime of the entire application will be less than the uptime of each of those components individualy. The calculator can be used to determine what that composite SLA will be for a given application by describing the topology of the application, the zone posture of the application, the paired-region coverage of the application, and any exclusion of the application that should be considered in the calculation of the application uptime. Each of the inputs for the calculator work to describe a different type of failure of the application.
How to calculate your app uptime on Azure
For instance, the compute topology input asks if the instances of the application are configure to cover for one another in the case of failures, which is referred to as “parallel” or “serial” mode. In parallel mode, if one instance of a component fails, the remaining instances of that component are still able to supply the service to users; in serial mode, each component is exposed to any failure within that component. The zone setting input asks if the application is designed to withstand failures in one region of Azure only, or if it is reliant upon a single data center within that region.
Paired-region coverage asks of the application how much of the traffic is expected to be able to move to another region should that region fail, as well as the reliability of the failover procedures for the application. Finally, the detection delay and planned exclusions inputs ask for the number of minutes that the application is likely to be down during automatic failover, which may occur due to the time required for failover procedures to occur, as well as for any planned downtime procedure for the application. The output of the calculator displays not just the percentage of uptime of the application, but also the expected downtime for the application, the target uptime percentage for the application, and the margin between the expected downtime and the target uptime.
Additionally, the calculator can reveal which specific path of the application has contribute to the most downtime for that application. The margin helps to indicate whether or not the organization is meeting their uptime goal, and whether there are any serial dependency within the application that are reducing the uptime of that application. Should the margin be negative, the calculator will indicate that the serial dependency is the focus of the application rather than the parallel instance of that application; adding instances in a parallel configuration cannot compensate for failures in a component that is part of a serial request.
Many organizations will find that the uptime percentage of their application is lower than they had considered possible. For instance, an organization might create an application that utilizes availability set, a zone-redundant database, and a traffic manager. The uptime of such an application may reveal that the identity service and the private link network are being create with serial dependencies within the application.
Such a finding will indicate that the uptime of the application will be less than that of each component of the application individually, and that the application may experience tens of minute of downtime each month. These differences in uptime can place that organization’s services at risk. The reference tables for the calculator provide information that will assist in ensuring that the organization enters the calculator with accurate inputs.
Each of these tables can provide information regarding the SLA of the different components of the application, the mathematical calculation that should be performed for both serial and parallel configurations of those components, and the amount of downtime in minutes of each percentage of availability. For instance, the table may indicate that 99.95 percent of availability allows for 22 hour of downtime each year. Additionally, the number of minutes of downtime will only decrease with the addition of zones, availability sets, and paired region that can provide a failover for the application’s traffic.
It can be difficult to decide which components of an application should be represented as “dependencies” of that application. Components like networking, DNS, and third-party identity services may seem like they are not required for an application, but they are actualy required to be able to route traffic to that application in the case of a regional failure. By naming these dependencies as an input for the calculator, organizations can see the impact that these dependencies can have upon the uptime of their applications.
One of the main benefit of the calculator is that it allows organizations to have a conversation with their finance and support departments, as well as the platform upon which they are hosting their applications, using the same numbers. By using the calculator, for instance, an organization can determine that adding a second zone to their availability set will reduce their expected downtime by a certain amount. Additionally, the organization can utilize the calculator to indicate that if they select a 60 percent plan for paired regions, that their 40 percent of their traffic will be exposed to potential failure in those regions; this information can enable these departments to take action to ensure that the application runs smooth for their customers.
Organizations often will run the calculator several times before they are satisfied with the uptime percentage of their application. For example, they may try different zone postures or paired-region percentages to see how the margin change. It is unlikely that the uptime percentage that is calculated will be the same as the target uptime that the organization desires.
However, the difference between the two percentages can help to indicate to the organization which design decision are the most important to make to that application.