Ping Latency Calculator
Diagnose ICMP ping tests from payload size, sent and received probes, RTT samples, jitter, route hops, medium delay, processing delay, and the gap between the measured result and the physical latency floor.
| ICMP payload | IPv4 packet | Common command use | Diagnostic meaning |
|---|---|---|---|
| 0 bytes | 28 bytes | Minimal synthetic probe | Mostly path and device latency, little serialization |
| 32 bytes | 60 bytes | Windows default ping | Good quick host reachability sample |
| 56 bytes | 84 bytes | Linux default ping | Common baseline for min, avg, max RTT comparison |
| 1472 bytes | 1500 bytes | IPv4 MTU check | Finds fragmentation or black-hole MTU problems |
| 8972 bytes | 9000 bytes | Jumbo MTU check | Useful only on paths designed for jumbo frames |
| Latency metric | Good | Watch | Investigate |
|---|---|---|---|
| LAN average RTT | Under 1 ms | 1 to 5 ms | Above 5 ms |
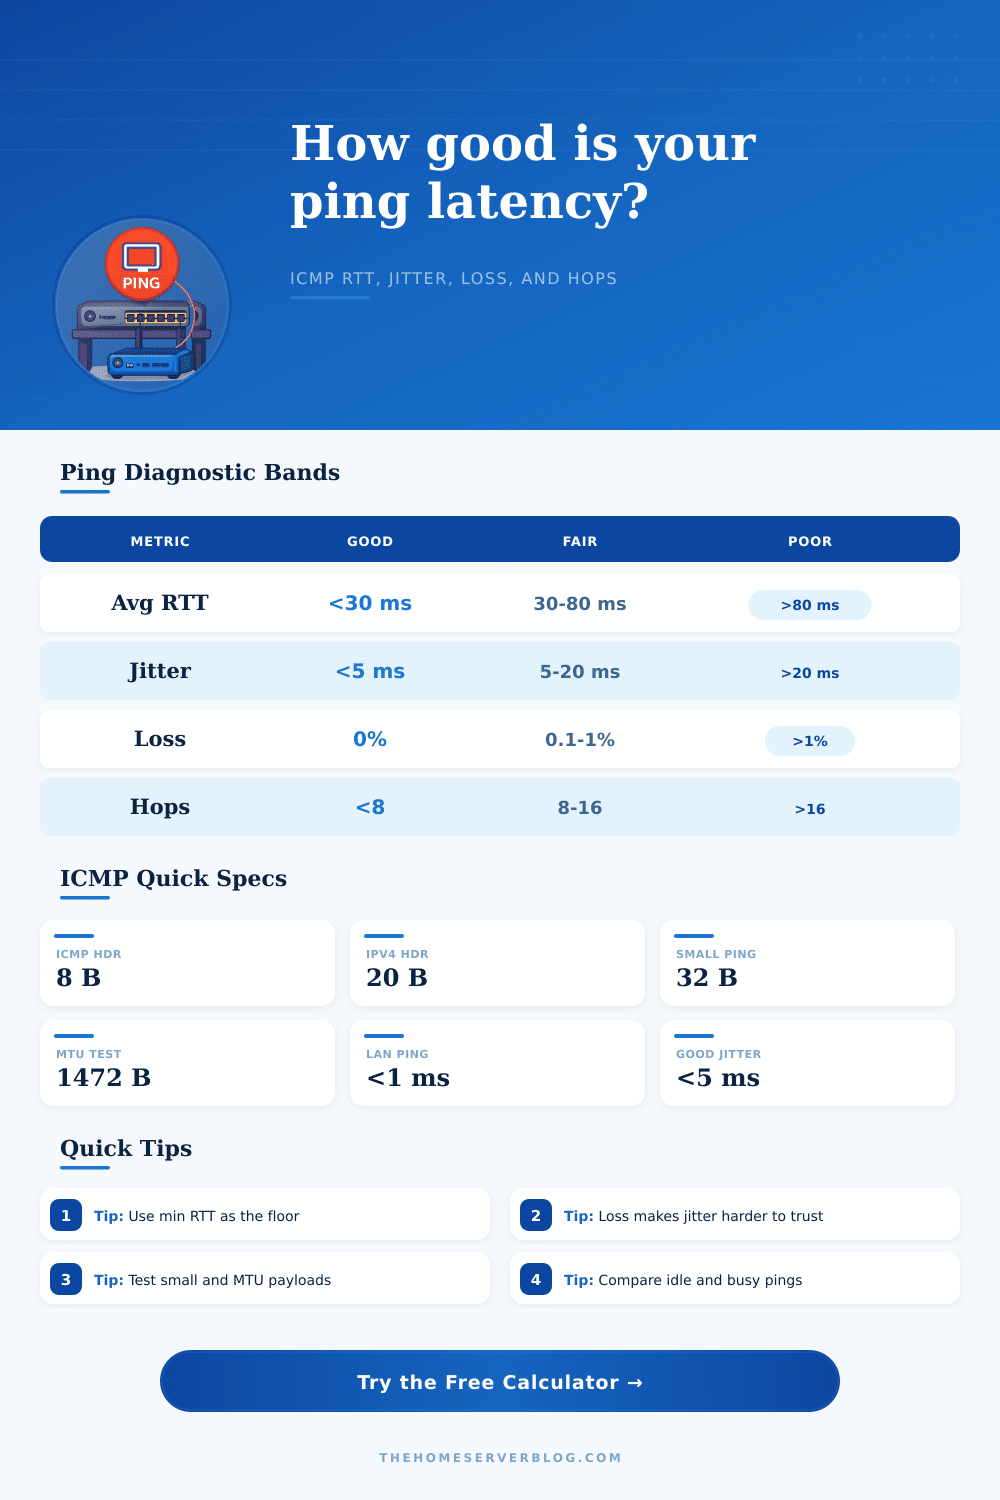
| Internet average RTT | Under 30 ms | 30 to 80 ms | Above 80 ms |
| Jitter spread | Under 5 ms | 5 to 20 ms | Above 20 ms |
| Packet loss | 0% | 0.1% to 1% | Above 1% |
| Avg above min | Under 3 ms | 3 to 12 ms | Above 12 ms |
| Medium | Velocity factor | RTT per 100 km | Ping caveat |
|---|---|---|---|
| Cat6 copper | 0.65 | 1.03 ms | Runs are short, so switches usually dominate |
| Terrestrial fiber | 0.67 | 1.00 ms | Long-haul distance sets a visible lower bound |
| Coax last mile | 0.85 | 0.79 ms | DOCSIS scheduling can add more than propagation |
| Wi-Fi air path | 1.00 | 0.67 ms | Contention and retries matter more than distance |
| LEO satellite | 1.00 | 0.67 ms | Space path and ground routing both contribute |
| Ping scenario | Typical hops | Expected sample | Primary diagnostic clue |
|---|---|---|---|
| Same Rack Server | 1 to 2 | 0.1 to 0.5 ms | NIC, switch, and host stack overhead |
| Home LAN Gateway | 1 to 3 | 0.3 to 2 ms | Router CPU, VLANs, firewall, and cabling |
| Wi-Fi Mesh Room | 2 to 5 | 3 to 25 ms | Air contention, band steering, and retries |
| ISP DNS Check | 5 to 10 | 5 to 30 ms | Last-mile scheduling and ISP edge routing |
| VPN Office | 8 to 18 | 20 to 90 ms | Encryption, tunnel MTU, and remote routing |
| Lossy WAN Link | 10 to 25 | Variable | Loss, queueing, and route instability |
If you’ve ever played online games with your friends only to find yourself dead before they even appear onscreen, then you know what I mean. You get up from your chair, check your internet connection speed and notice that you’re receiving gigabit speeds; what’s wrong? The answer: speed is not latency. But also everything.
Speed isn’t the same thing as latency. Even if a highway has ten lanes wide open for speeding cars, it doesn’t matter if all those cars is driving slow. A narrow country road could be faster then that if nobody was clogging its traffic. That’s what ping represents. How long does it take for something to reach your computer? And that’s different from bandwidth, or how much data are flowing down your pipe. Why do your downloads fly by, yet your clicks feel laggy?
Understanding Ping and Internet Speed
What’s nice about this tool (on this page) is that it breaks down the part of your actual connection. It separates that from the junky stuff the internet throws at you and the junky bits your gear add to get from here to there. So it calculates what your ping should of be given the distance and type of line. Then it compares what you actually measure to that floor. And that’s the important part. The closer your measured minimum round trip time matches that floor number, the cleaner your path. The farther apart they are, the more someone is throwing crap in the ether.
Is it wireless contention? Busy router? Is it a congested link halfway around the world? Without knowing that, you don’t have context for whether this is an issue with your own house or one in the cloud.
Because light takes time to travel, the farther away something is from you, the longer it takes, yes, even if they are sending data via fiber. To account for this distance, the calculator includes “velocity factor” of whatever medium the signal passes through (air moves faster than glass or copper). It also considers processing delay per hop: each router along the way must examine the packet, look up where to send it next, then pass it along. That takes a few microseconds, but enough hops and all those small delays adds up to milliseconds you notice.
A reference table on the page explains what’s contributing exactly to the overall time delay, so you can visualize how much time was spent traveling vs. Sitting in a queue. It’s all relative. The size of the payload matters a lot. Most links can slide a small ping packet through without jamming up traffic. But if you test with a bigger one (full MTU sized frame), you get to see the serialization delay on slower bottleneck link. Here’s where the math becomes interesting and reveals some of the hidden constraints. What looks like a slam-dunk for handling little packets may not has enough throughput headroom or buffer space to push big ones through. Test them both and you have a full picture of how healthy your connection is under various payloads.
The symptoms include instability. Stability means consistency. Even at somewhat high levels, a constant delay is a stable connection. Unstable connections jumps all over the place. Your devices can’t anticipate when to expect the next bit of data. This is why high jitter breaks up gaming and voice calls more than high average latency does. That spread is what the diagnostic grid points out for you, indicating whether your connection is steady or not.
Because lost packets result in retransmissions, wasting both bandwidth and time, loss is even worse. The average ping is what most folks tend to look at, and while that’s fine, it doesn’t necessarily mean anything if a few poor samples skew the overall reading. Your minimum ping will actualy be closer to your physical baseline as it’s literally the lowest round-trip time, the quickest possible journey given perfect conditions. So compare that to your average and you’ve got an idea of how much overhead you’re experiencing. If your average is twice that of your minimum, then you know there’s some serious queuing/interference happening along the way.
Try adjusting Wi-Fi channels or maybe reboot your router. If even the minimum is high, you’re probably dealing with some kind of routing or distance issue you won’t solve locally.
These layers make ping less of a mysterious number and more like a diagnostic chart. You no longer guess, “Oh god, something’s wrong; my connection must be bad.” Instead, you locate where the lag exists: in the wireless air link? Is it the hardware in your rack? Is it the long trip to the server? When you find the place of friction, then you can begin targeting your fixes rather than just throwing money at a faster internet plan, which won’t fix latency issues. Most users find themself far above their physical limit because of congestion and configuration errors; finding that limit lets you know how close you are to calling up your provider or upgrading your router. Knowing where those few milliseconds dissapears makes all the difference between an instant response and a laggy click.