Queuing Delay Calculator
Estimate router, switch, firewall, and server queue delay with utilization rho, M/M/1, M/M/c, burst, buffer, priority, and packet-size assumptions.
| Traffic profile | Typical arrival rate | Queue concern | Good planning target |
|---|---|---|---|
| VoIP and calls | 50 to 300 pps | Jitter and spikes | Keep queue wait under 30 ms |
| Gaming and SSH | 100 to 2,000 pps | Latency variance | Use priority class below 0.75 factor |
| NAS backup | 10,000 to 120,000 pps | Microbursts | Reserve buffer for bursts, not only average |
| Camera NVR | 2,000 to 40,000 pps | Continuous ingress | Watch rho during motion-heavy windows |
| VPN firewall | 1,000 to 80,000 pps | CPU service time | Model service variability above 1.0 |
| Utilization rho | Queue interpretation | Likely symptom | Action |
|---|---|---|---|
| 0.00 to 0.50 | Light queue | Delay mostly serialization | Normal headroom |
| 0.50 to 0.75 | Healthy busy link | Small waits during bursts | Keep monitoring |
| 0.75 to 0.85 | Watch zone | Delay grows nonlinearly | Shape or add capacity |
| 0.85 to 0.95 | Congestion prone | Bufferbloat and jitter | Reduce arrival or increase mu |
| 0.95 and above | Unstable edge | Long queues or drops | Redesign before production |
| Packet size | 1 Gbps serialization | 10 Gbps serialization | Practical note |
|---|---|---|---|
| 64 bytes | 0.0005 ms | 0.00005 ms | PPS load dominates |
| 512 bytes | 0.0041 ms | 0.00041 ms | Common mixed LAN frame |
| 1500 bytes | 0.0120 ms | 0.00120 ms | Standard Ethernet MTU |
| 9000 bytes | 0.0720 ms | 0.00720 ms | Jumbo frame storage path |
| Preset scenario | Model intent | Main risk | What to tune first |
|---|---|---|---|
| Home Fiber Router | Single WAN queue | Upload bufferbloat | Service rate and buffer depth |
| Busy WiFi AP | Shared airtime queue | Variable service | Service variability and priority |
| NAS Backup Burst | Large short bursts | Tail drop | Burst size and buffer depth |
| Core LACP Bundle | Parallel drains | Uneven hashing | Servers c and per-link mu |
Sometimes, in the middle of an important meeting, there’s a freeze in the video feed. Audio start stuttering and dropping out for three seconds. A spinning icon stares back as your colleague patiently hangs on line. It seems like a technical glitch, yet most of the time, it’s due to bad queue management. No, your router didn’t crash. And no, your internet provider hasn’t dropped its connection. A few data packet are just waiting too long in a digital holding pattern. Knowing what causes it let you resolve it ahead of time before the next call.
In most home networks, we have an M/M/1 configuration: one service channel and one stream of arrivals. In other words, a single lane checkout line at grocery store. When customers arrive more slowlier than the cashier can scan their items, the line will be short. But when they arrive faster then that (even temporarily) the line becomes exponentially long. Once you input your estimated link speeds and packet rates into this thing, the calculator do all the math for you. No need to guess if your bufferbloat is choking your upload capacity. Just know what those inputs mean in real life.
Why Your Internet Feels Slow
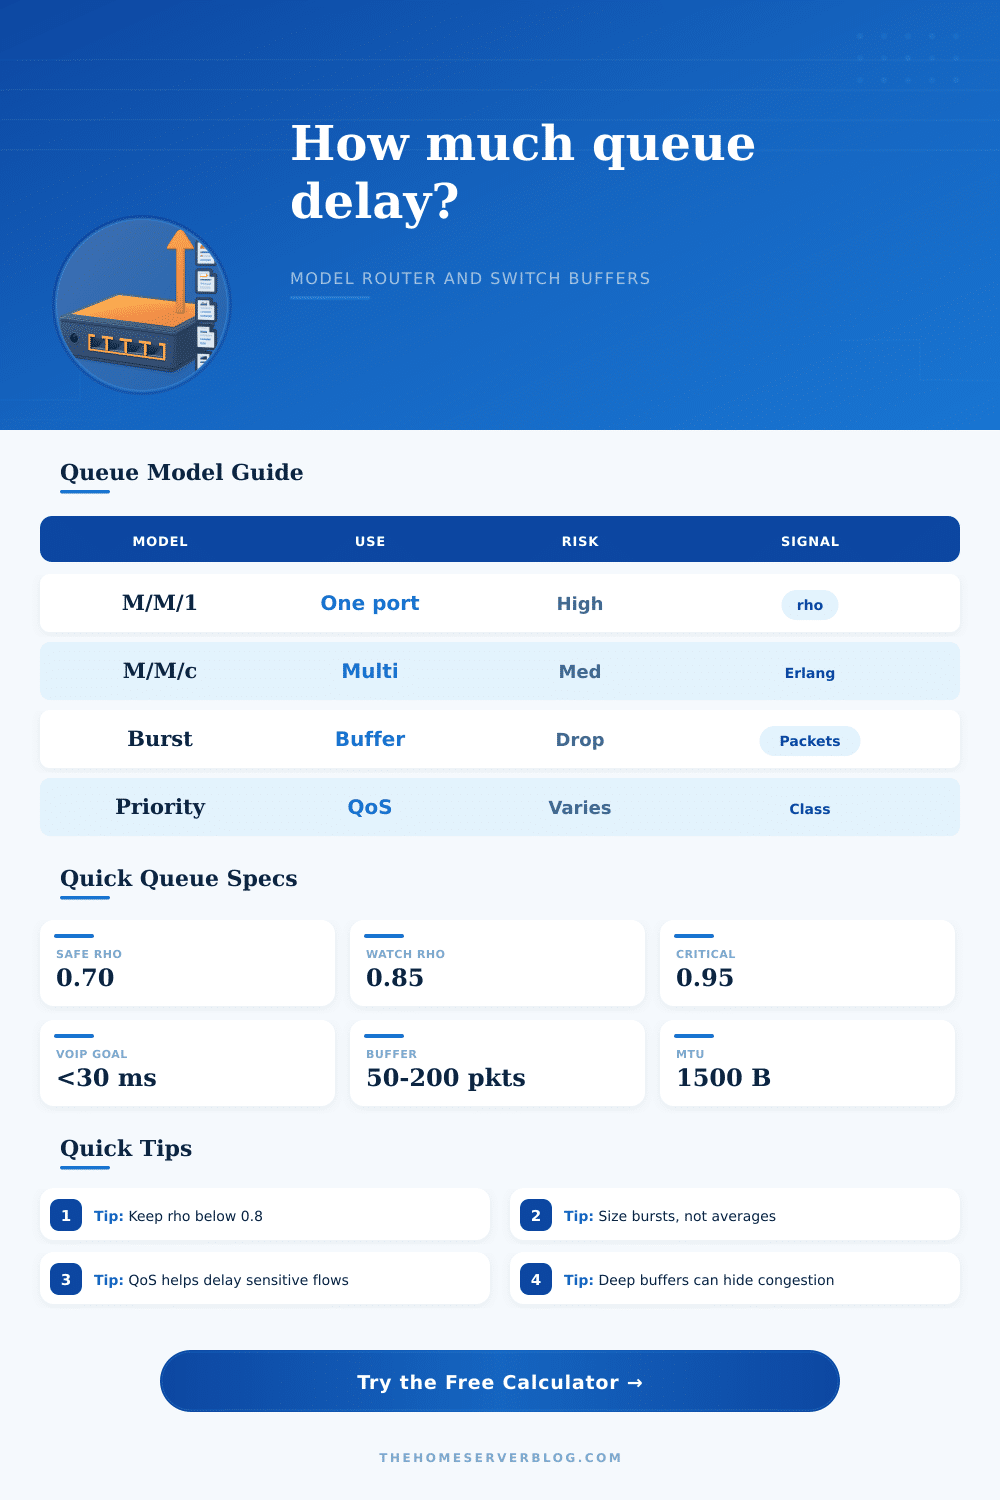
And then there’s rho: use. How much of your connection’s capacity are being used? That’s the single most important variable. When it reaches zero point eight five, you’re in trouble. Small increases in network traffic results in huge increases in delay. And that’s what causes games to feel laggy at night time but feel okay during the day. Everyone turns on their stream and suddenly the link is too full for even a single packet. Any additional packet gets queued up, waiting a long time to be transmitted.
Most people only think about average bandwidth. They think they’ve got headroom. They don’t remember that queuing theory also cares about variance. The average isn’t what matters; it’s the burst. You can send ten thousand packets per second for ten seconds. That’s a sudden wall of traffic to your router. If you have a large enough buffer, those packets will sit there waiting to be sent. They hide the congestion from your device which continues to send more data. Finally, the queue overflow, and it drops packets. Better to have a shallow buffer so it would of signal congestion early on.
Newer routers implement algorithms such as FQ-PIE or CoDel that quickly drop or mark these excess packets. That way, instead of having your router filled with stale data, your computer slow down. That’s where prioritization (or priority queuing) come into play, provided it’s done right. Delay is the enemy of VoIP more than anything. Some packet loss are acceptable. Throughput matters to bulk transfers like file downloads; delay doesn’t.
Mixing the two together in the same bucket is bad news: bulk traffic will clog the pipe and murder your phone call. That’s why the table on the page spell things out so clearly. Voice traffic should have its own fast lane that skips the regular queue. Even with somebody trying to download a huge game update, your words still make it through.
There’s also the hidden trap of service variability. Different types of hardware don’t process packets at an equal and consistent pace. A simple switch ASIC does so quite steadily. But a WiFi access point that has to deal with sharing airtime or a CPU driven firewall are far more variable. Even when the average load appear fine, the higher variability will cause your wait time to be considerably longer. The tool lets you adjust the variability coefficient and thus model out how jumpy your service path actualy is.
But don’t trust the numbers. Remember, these are models. They don’t account for protocol overhead, hardware quirks or noise in real networks. Let it tell you what’s slow. Run some real traffic through it. Download something big, then ping a server somewhere. Look for any latency increases. If your numbers are great but you’re still getting a lousy experience, inspect your QoS settings or buffer sizes. The math plots the map. You measure the terrain.
So keep your use under zero point eight. Buffer for bursts, not averages. And always make sure voice traffic gets the green light. They keeps the connection clear and the calls smooth.