Hosting Bandwidth Calculator
Estimate monthly transfer from page weight, visits, cache hit rate, media downloads, API calls, peak multiplier, CDN offload, and safety buffer.
⚡Hosting presets
📊Traffic inputs
Bandwidth estimate
Calculation breakdown
🖧Traffic component grid
💻Hosting profile reference
📘Page and cache planning table
| Site type | Typical page weight | Cache hit target | Bandwidth note |
|---|---|---|---|
| Static documentation | 0.8 to 1.8 MB | 85% to 98% | HTML is small; images and fonts dominate transfer. |
| WordPress blog | 1.8 to 4.0 MB | 60% to 90% | Theme assets, thumbnails, and ad scripts raise page weight. |
| Portfolio or gallery | 3.0 to 8.0 MB | 70% to 95% | Image compression and lazy loading change the estimate quickly. |
| Forum or community | 1.5 to 3.5 MB | 35% to 75% | Logged-in pages and personalized feeds reduce shared cache hits. |
| SaaS dashboard | 2.0 to 6.0 MB | 30% to 70% | App bundles cache well, while data payloads stay dynamic. |
📦Media and API component table
| Component | Typical size | Offload behavior | Planning check |
|---|---|---|---|
| PDF or docs download | 2 to 25 MB | Very CDN friendly | Track downloads separately from page views. |
| Image pack or gallery zip | 20 to 500 MB | Very CDN friendly | A few popular files can exceed normal page traffic. |
| Short video file | 50 MB to 2 GB | CDN or object storage preferred | Use actual average viewed bytes when possible. |
| JSON API response | 1 to 100 KB | Varies by endpoint | Multiply by calls, retries, polling, and mobile refreshes. |
| Webhook or ingest request | 1 to 50 KB | Usually origin handled | Bursty traffic may matter more than monthly transfer. |
📈Common hosting scenarios table
| Scenario | Monthly activity | Main driver | Transfer pattern |
|---|---|---|---|
| Starter blog | 10k to 30k visits | Images and theme assets | Moderate, cacheable page traffic. |
| Small forum | 40k to 120k page views | Dynamic pages | Lower cache rate with steady origin traffic. |
| Release mirror | 2k to 20k downloads | Large binary files | Media transfer dominates page transfer. |
| Public home lab | 5k to 80k visits | Docs, screenshots, API demos | Mixed cacheable and dynamic content. |
| API service | 100k to 5M calls | Payload size and polling | Small objects, high request count. |
⚙Conversion and formula table
| Metric | Formula | Use | Practical note |
|---|---|---|---|
| Page transfer | Page views x page weight | Baseline web traffic | Use measured transferred bytes, not uncompressed source size. |
| Origin page bytes | Raw x cache miss x CDN miss | Server-side egress | High cache and CDN offload sharply reduce origin transfer. |
| Monthly GB | All bytes / 1024 MB | Transfer planning | This calculator uses binary 1024-based units. |
| Average Mbps | GB x 8192 / seconds | Peak capacity check | Real traffic is burstier than the average rate. |
| Buffered transfer | Net x overhead x buffer | Planning allowance | Use a larger buffer for launches, newsletters, and releases. |
With the best of intentions, you launch a new website with a clean conscience, and no worries about bandwidth restrictions. Everything goes great, and then a spurt of referrals via social media suddenley makes your little-sleeper site a bustling hub. Or, perhaps you send out your first newsletter blast. Then the panic sets in: You realize that your transfer meter is ticking upward at a pace you didn’t anticipate.
Webmasters who think of bandwidth as an idea (instead of something concrete), measured by a stream of data, is all too familiar with this feeling. Each time someone clicks on your site, each image loads, each API call are used: All consume bytes, which your host carefully monitors. But how can you know just how much?
How to Calculate Your Website Bandwidth Needs
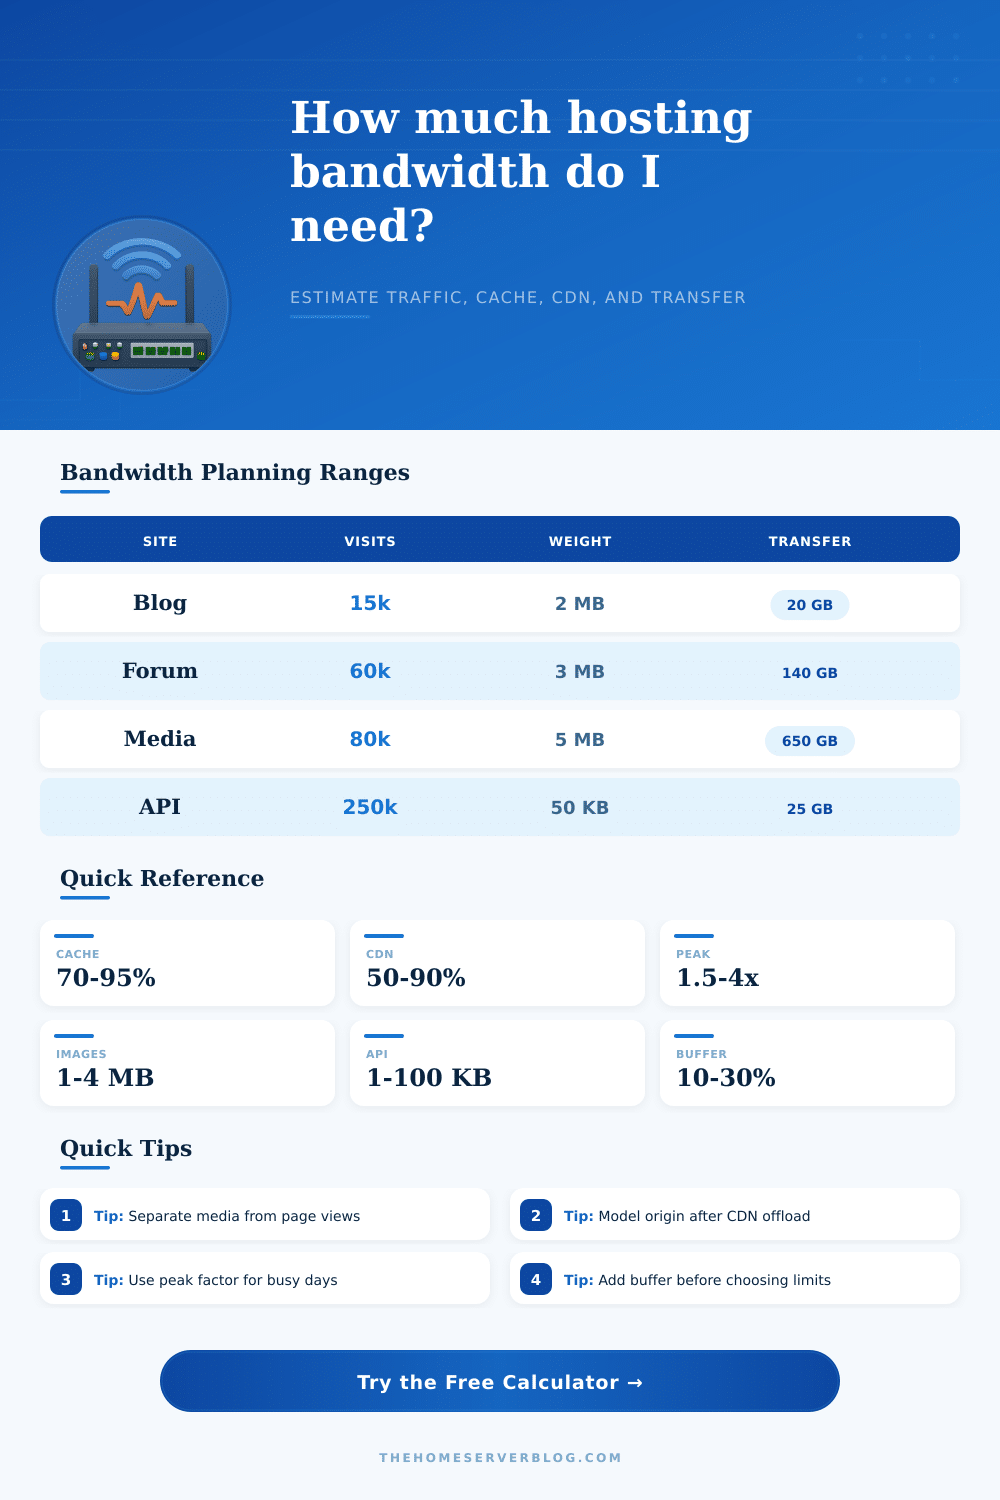
The first step to understanding usage is differentiating between raw visitor counts and true weight of their downloads. Visits is easy to estimate, so most folks begin there, and it’s a good base number. But visits don’t tell you anything about bandwidth usage. Some pages are text-heavy and only cost two megabytes per visit, whereas others may be a photo gallery, pushing up to eight or ten. Multiply these numbers by the thousands of session each month, and the difference is huge. You’re not interested in counting the number of visitors who open your web address; you want to know what they’re actualy transferring across the wire.
That’s where cache efficiency saves the day. When you serve the same header image to every visitor, you’re wasting valuable resources. These could be moved to a content delivery network or even your user’s own browser cache. When your cache hit rate is high, origin server doesn’t even have to lift a finger to serve returning visitors, this makes a dramatic difference in math.
Even beyond pages, there’s another wrinkle… Media files and API responses. Not all web traffic are created equal. Downloading a podcast or viewing a PDF report don’t work the same way as visiting a normal website. Depending on its delivery method, it’s a heavyweight that skips most caching strategies entirey. Likewise, you may have a SaaS dashboard serving thousands of small JSON payloads per hour. These little request can accumulate fast, particularly when your app keeps polling for data. You can’t toss these into the same bucket as static page views and hope for the best. They follow unique rules for your transfer quota and deserves to be tracked separately.
Theoretical vs Practical: Traffic peaks are where theory becomes practice. Sure, your traffic stats may seem reasonable to you, but what about hosting providers? They’re interested in your peak traffic, so let’s say you have a viral blog post, and all of your readers comes rushing onto your site at once during the middle of a Tuesday afternoon. Although your total traffic for the month isn’t any different than before, suddenly you need much more bandwidth instantly.
A peak multiplier lets you visualize this stress test. You aren’t merely preparing for the calm days, you’re preparing for the chaos. That way, you don’t hit overage fees or throttled speeds during high-traffic periods.
The last part of the formula? It is a safety buffer. That’s for unforeseen increases, protocol overhead and all those little inefficiencies when you’re transferring bits around digitaly. This is a nice cushion to add as a percentage on top of what you think you would of require. That prevents you from selecting a host that has just enough bandwidth today but fails tomorrow.
It saves you from converting units in your head and making mistakes. All you have to do is provide your expected download rates and page sizes. Then, let it crunch the math for you (the form above does this). Just enter some real-world estimates for your figures.
This isn’t predicting the future; it’s planning based off how your site is built: The way to think about bandwidth is in terms of how you’ve built your site, which is naturaly a set of different pieces. If you can separate out the cost of data calls from the cost of media, from the cost of pages, then it suddenly makes a lot more sense how you’ll get a hosting plan that doesn’t leave you with bill shock each month.
That change in thinking is a switch from guesswork to building what you need based on real information flow. This allows you to turn a billing “surprise” into something you can handle operationally. From there, you’re not dealing with a fire; you’re just handling a fact.