95th Percentile Billing Calculator
Estimate billable bandwidth from sample interval, total samples, discarded top 5%, Mbps samples, burst duration, commit rate, and sustained usage.
⚙ Traffic presets
📈 Sampling inputs
🧮 Percentile sampling grid
📋 Calculation breakdown
| Sample band | Count | Rank range | Mbps range | Interpretation |
|---|---|---|---|---|
| Run the calculator | 0 | 0 | 0 Mbps | The sorted sample bands will appear here. |
| Top sample rank | Mbps | Status | Reason |
|---|---|---|---|
| Run | 0 | Waiting | Highest samples will be sorted here. |
⏱ Sampling interval reference
| Interval | 30-day samples | Discarded samples | Discarded time | Billable rank |
|---|---|---|---|---|
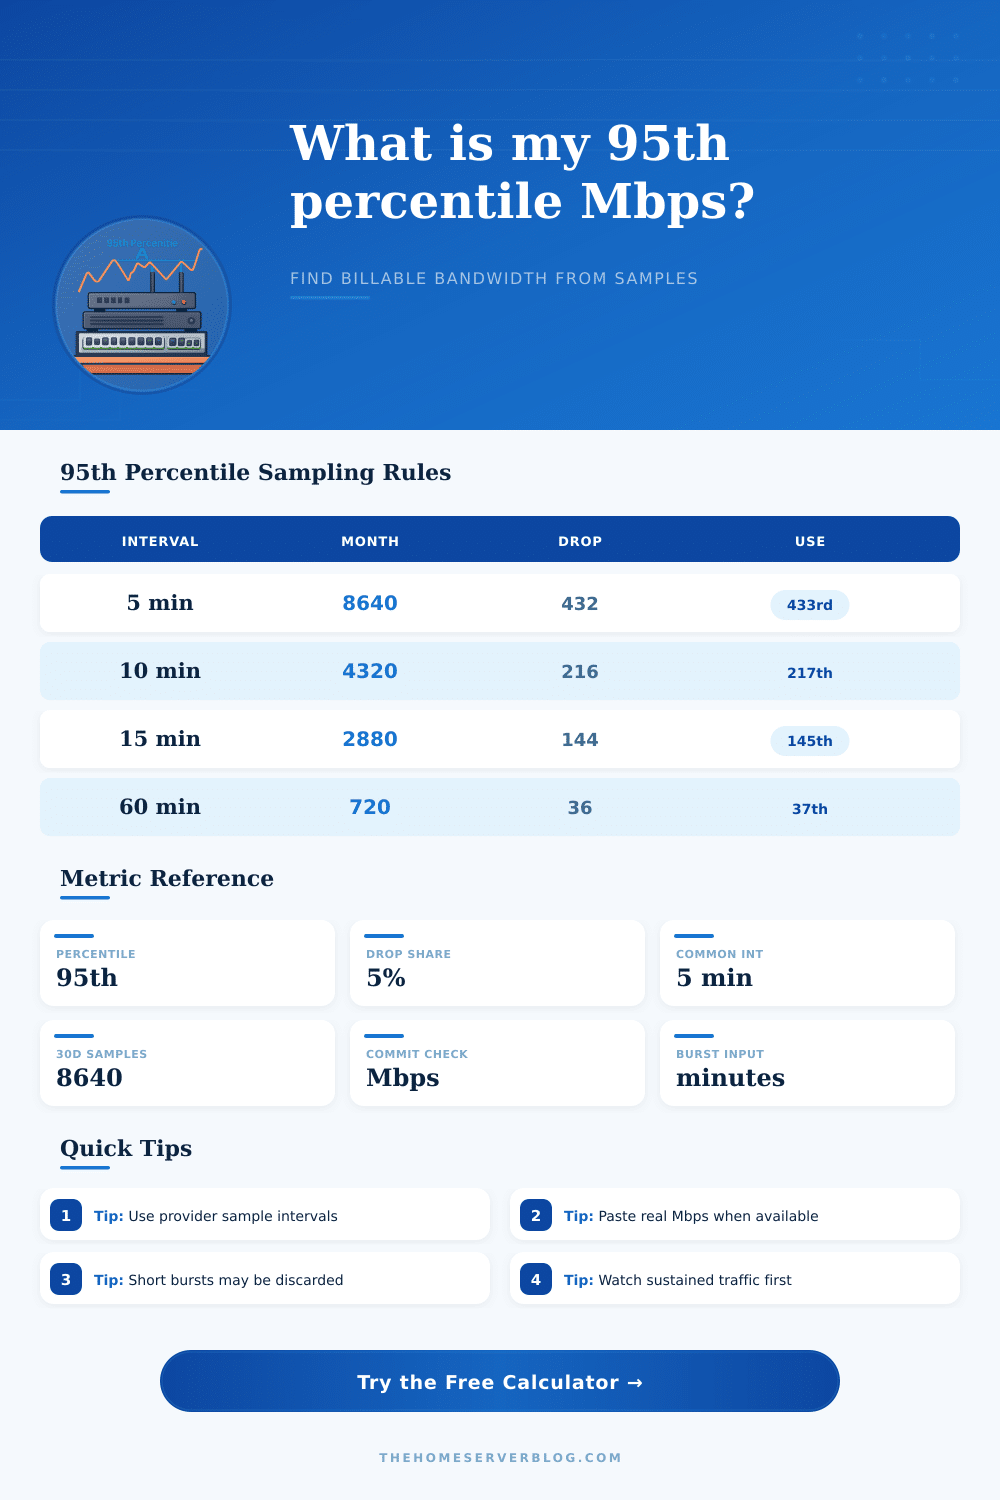
| 5 minutes | 8,640 | 432 | 36 hours | 433rd highest |
| 10 minutes | 4,320 | 216 | 36 hours | 217th highest |
| 15 minutes | 2,880 | 144 | 36 hours | 145th highest |
| 30 minutes | 1,440 | 72 | 36 hours | 73rd highest |
| 60 minutes | 720 | 36 | 36 hours | 37th highest |
🖧 Traffic shape guide
| Shape | Typical pattern | 95th effect | Watch metric |
|---|---|---|---|
| Flat server traffic | Always-on services | Close to sustained usage | Baseline Mbps |
| Business hours | Daytime application load | Busy window often remains | High-hour Mbps |
| Evening-heavy | Streaming and remote access | Repeated evenings can count | Duration |
| Nightly backup | Short transfer windows | May be discarded if brief | Burst minutes |
| Irregular bursty | Deploys, mirrors, imports | Depends on repeated samples | Top 5% budget |
💡 Practical tips
📚 Preset comparison table
| Preset | Sustained | Burst | Duration | Useful for |
|---|---|---|---|---|
| Small Home Lab | 35 Mbps | 180 Mbps | 15 min | Self-hosted services |
| Nightly Backups | 90 Mbps | 950 Mbps | 90 min | Backup windows |
| Static CDN Origin | 220 Mbps | 750 Mbps | 20 min | Cache misses |
| Game Server Cluster | 260 Mbps | 520 Mbps | 180 min | Long evening peaks |
For example, their “ninety fifth percentile” billing system means they’ll keep your costs down if you play games or transfer big files over extended periods of time. You get charged for actual usage patterns, except for very short bursts… With this design feature ignoring transient spikes and charging you for sustained behavior. Thousands of data points goes into the calculator, which throws away top five percent. That saves you from trying to visualize how many hours is hidden inside that discarded chunk.
What’s this got to do with anything? Everything. To measure bandwidth, providers takes periodic snapshots of what you’re doing every few minutes all month long. If you use your connection just for email checking, the snapshot will be different than if you has a home lab running. The provider tosses out top five percent of your data completely because most of the time, those are just high speed bursts. In normal usage over a month, that typically means roughly thirty six hours of your absolute peak traffic dissapears off your bill without a trace.
How Bandwidth Billing Works for You
A quick nightly backup job fit right into that bucket and never shows up on your bill at all. It doesn’t make enough difference in the overall average to cost you a penny more. But there’s also the question of when you use it; and what gets counted at the end of the month. You may get away with a single ten minute spurt, but if you go hard for three hours, that go on the books. In such a scenario, consistent usage matter more then top speed. A lot of users care about max bandwidth capacity, but don’t realize that duration is far more important for cost than intensity.
To help you understand the impact of time before locking into rate plan, the tool will let you model various traffic profiles to see how duration impacts the result. The other issue most people struggle with is picking the proper sample time interval. Because of limitations on how much data can be handled, most ISPs stick to 5 minutes. That provide enough detail while also keeping the amount of data manageable.
If you choose an hour as your sample, then you will end up with more days where all the traffic was quiet and your bill appears less than what a more detailed sample might indicate. Conversely, if you pick a really small window, like five minutes, then you’ll capture those momentary spikes in bandwidth usage which might get lost in bigger chunks of time. In one sense, there’s no better or worse. It’s simply a matter of capturing different types of traffic patterns during this culling process. To make sure the calculator matches reality, set it for the same time period as your actual ISP measurements.
The other wrinkle in this math is commit rates. Paying a baseline level of fixed speed will cover most (or all) of your monthly needs; anything above that get metered with the percentile method. If that ninety fifth result falls under your commit amount, you’ve protected yourself against changes in traffic patterns. The calculator displays exactly how far you’ll be from your committed line and how much room remains for variation in your use. Having some extra space is smart planning, having an enormous chasm suggest you’re probably paying for more bandwidth than you ever use.
We want to know how people really consume things, not fool around with it and try to get away with stuff. For instance, if you run a game server then every single sample matters differently from someone running a quiet blog. The average of all your samples doesn’t show what’s happening in the day-to-day life of the network as clearly as looking at the ratio between the peak value and the sustained usage. This makes the megabit less of an abstract number and turns it into a story about how people use the internet. It is a story that, once you know it, no longer surprises you and becomes predictable making it a predictable expense.