Recovery Point Objective Calculator
Estimate the real data loss window for home lab backups, snapshots, replication, and journal retention against a selected compliance tier.
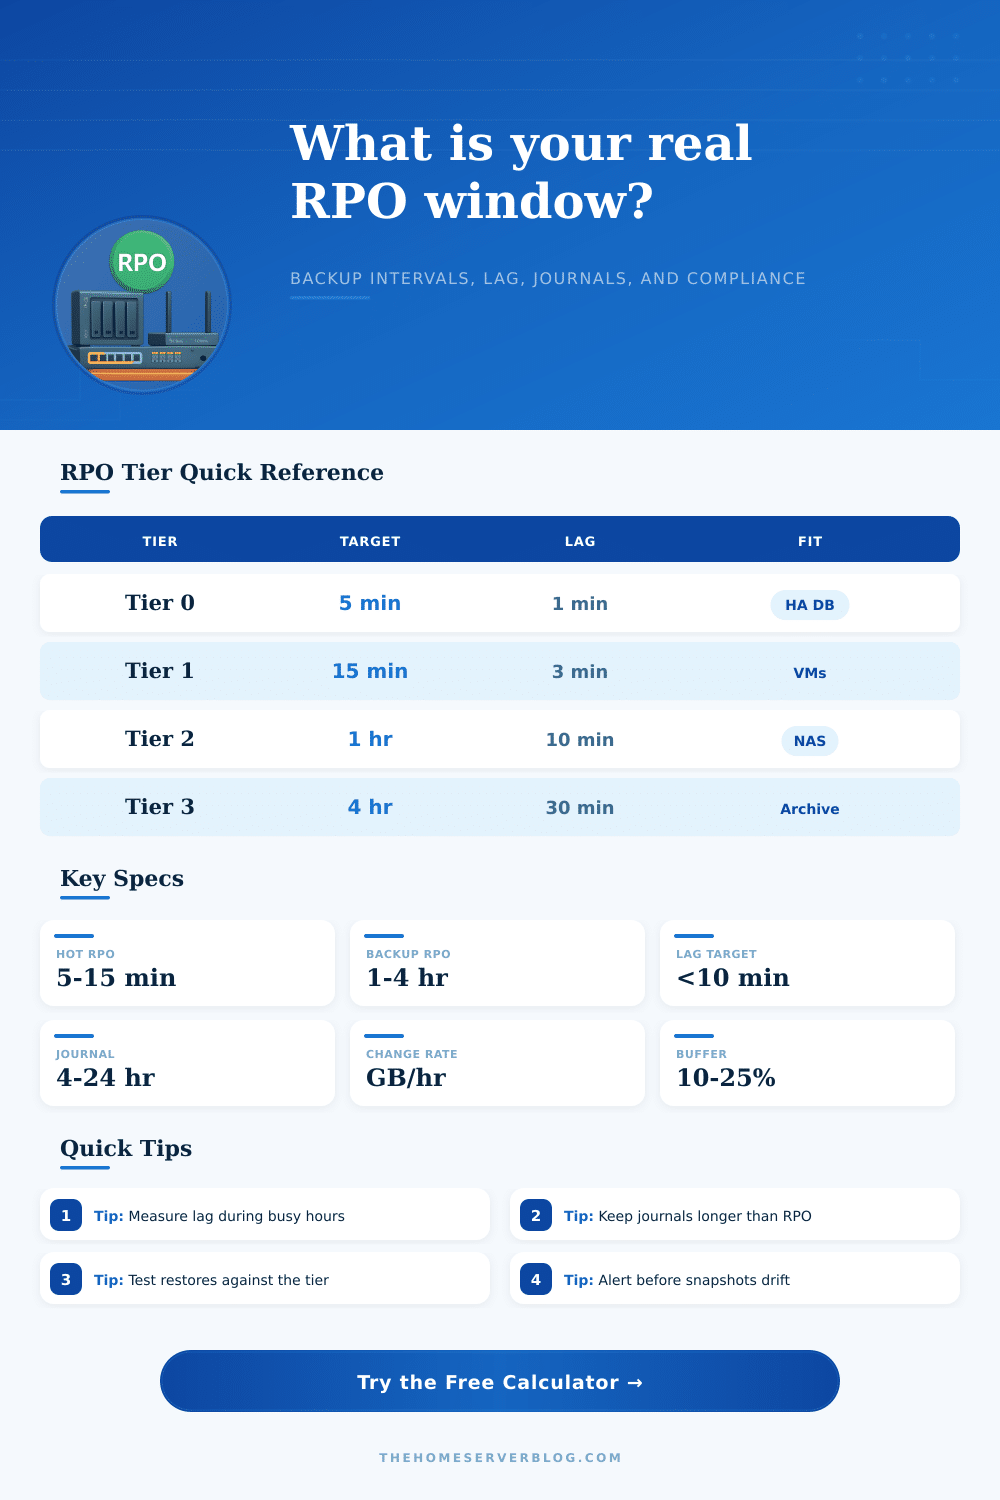
| Tier | Target RPO | Typical Workload | Expected Protection |
|---|---|---|---|
| Tier 0 Critical | 5 minutes | Active databases, identity, order systems | Continuous replication, PITR journal, alerting |
| Tier 1 Important | 15 minutes | VM hosts, self-hosted apps, project shares | Frequent snapshots plus replica monitoring |
| Tier 2 Standard | 1 hour | NAS shares, laptops, common home lab VMs | Hourly backups or snapshots with offsite copy |
| Tier 3 Home Lab | 4 hours | Test VMs, media metadata, noncritical services | Scheduled backups with normal retry windows |
| Tier 4 Archive | 24 hours | Media library, cold files, historical exports | Daily backups, versioning, checksum validation |
| Method | Usual Interval | RPO Strength | Planning Note |
|---|---|---|---|
| Filesystem snapshots | 5 to 60 minutes | Fast local point-in-time recovery | Needs pruning and separate backup target |
| Image or VM backups | 30 minutes to 24 hours | Reliable restore points and catalogs | RPO depends on job finish and retry behavior |
| Block replication | Near real time | Low data loss when lag is monitored | Can replicate corruption without journals |
| Database PITR journal | Seconds to minutes | Granular rollback for app state | Journal retention must exceed incident detection |
| Cloud sync versioning | Minutes to hours | Good for files and documents | Check version limits and ransomware handling |
| Profile | Backup Interval | Snapshot Frequency | Journal Retention |
|---|---|---|---|
| Home NAS shares | 60 minutes | 30 minutes | 12 to 24 hours |
| Proxmox VM cluster | 120 minutes | 15 minutes | 8 to 24 hours |
| Self-hosted apps | 30 minutes | 15 minutes | 24 to 72 hours |
| Photo library | 240 minutes | 120 minutes | 24 hours |
| Media archive | 1440 minutes | 720 minutes | 0 to 12 hours |
| Change Rate | 15 Minute Risk | 1 Hour Risk | 24 Hour Journal |
|---|---|---|---|
| 1 GB per hour | 0.25 GB | 1 GB | 24 GB |
| 5 GB per hour | 1.25 GB | 5 GB | 120 GB |
| 20 GB per hour | 5 GB | 20 GB | 480 GB |
| 75 GB per hour | 18.75 GB | 75 GB | 1.8 TB |
Your recovery point objective (RPO) is the amount of time you are willing to lose in work, memories, or progress before calling a failure. In other words, it’s the amount of time you can afford to lose before a setback becomes too expensive to fix.
Most people view their backup as a switch, either it’s on, protecting them, or it’s off. But true protection involve more than just turning on backup. You also need to consider how often changes is captured, how long it take for those changes to copy, and if there is any way to fill in the gap.
Understanding Your Data Loss Risk
To calculate data loss window, the calculator takes into account replication lag, snapshot frequency, and backup timing. For example, you may think that one-hourly backups means an hour of possible data loss. With five-minute replication lag at peak load times and 30-minute snapshots, however, your risk shifts. It sums up all those time frames and plots where you stand in relation to typical compliance levels.
The key isn’t nailing down an exact number on every metric; it’s understanding what goes in. While change rate can be an abstract concept until you experience data loss, if you’re editing large media file or running busy databases, creating twenty gigabytes of changes per hour, then the amount of data lost during a longer RPO becomes substantial. Thirty minutes might be fine for static documents, but that same timeframe puts high-write workloads at risk.
Rate determines how many gigabytes are actualy at-risk during your calculated window. It tends to surprise users who translate those abstract minutes into something real: storage liability.
The next level ignored by most (until they wish they’d done so) is journal retention, which gives you a safety net in case you didn’t detect something in time. Most often, you won’t catch corruption when it occurs; you’ll only know it after hours. Sometimes you won’t know until someone is investigating. That means if you don’t keep journals longer than the time between the corruption happening and you noticing it, you can’t get back to a clean state, no matter how often you back up.
The page has some reference tables of common workload types and their typical profiles. It should of give you a sense of what others think is reasonable for similarly configured systems.
Additionally, think about what kind of approach makes sense for your environment: replica-first (lower lag) or backup-first (reliable restore point). Replica will replicate errors unless closely monitored; backups has a higher gap between capture points. Oftentimes, a mix is best, striking a balance between speed and integrity. -> Often, a mix is best, striking a balance between speed and integrity.
You can play around with this in the calculator by switching between replicas/backups to see how your risk profile changes as a result. This helps you troubleshoot / plan out when to upgrade or tweak a configuration that feels risky / slow.
Some common missteps include over-estimating capabilities based off goals without testing how it actualy works: for example, you want an RPO of fifteen minutes, but your backups go to a network drive which hits its maximum throughput at night, so it takes forty-five minutes instead. The tool also has an option to account for validation/queue delays. Tack on another ten-twenty percent as overhead.
This leaves you some breathing room if something goes wrong with a piece of hardware or the backup schedule slips slightly. It can be the difference between a smooth restore than scrambling under stress.
What’s your RPO? How much data are you willing to lose? Protection gaps: How do you know if your protection really works? Real-world lag measured during peak periods will be different than average lag on a quiet night.
Now that you have some numbers, it’s time for educated choices. Decisions based off your own comfort levels regarding cost vs. Complexity vs. Peace-of-mind. You don’t want perfect backup, just acceptable risk in alignment with your priorities.