Azure Egress Cost Calculator
Estimate monthly outbound transfer from Azure workloads using only the rate, allowance, and traffic assumptions you enter.
⚙Workload presets
📡Traffic and rate inputs
Azure egress estimate
🖧Traffic component grid
📊Reference tables
| Workload preset | Traffic volume | Offload focus | Rate behavior |
|---|---|---|---|
| App Service Site | Moderate web responses | Static files and pages | User-entered only |
| Static Web + CDN | High read volume | Edge cache hits | User-entered only |
| AKS API Cluster | Bursty API payloads | API cache and compression | User-entered only |
| Blob Media Library | Large object downloads | Edge delivery and resizing | User-entered only |
| Input | What it changes | Typical source | Model effect |
|---|---|---|---|
| Outbound transfer | Starting monthly GB | Azure metrics or logs | Base traffic pool |
| CDN/cache offload | Origin-path misses | Cache analytics | Reduces public transfer |
| Compression | Payload size | Web server telemetry | Reduces optimized GB |
| Private offset | Non-public flow | Network design notes | Subtracts private GB |
| Peak factor | Monthly burst shape | Forecast or trend | Adds planning load |
| Traffic component | Specification | Calculator handling | Review point |
|---|---|---|---|
| Web pages | HTML, CSS, JS, images | Offload plus compression | Large static assets |
| API responses | JSON, XML, gRPC | Compression plus peak | Polling and retries |
| Blob downloads | Objects and media | Offload plus route factor | Direct hotlinking |
| Hybrid sync | Replica and file flow | Private offset plus factor | Path classification |
| Formula step | Expression | Purpose | Result shown |
|---|---|---|---|
| Normalize | GB or TB to GB | Common unit | Base transfer |
| Optimize | Base minus offload and compression | Miss traffic | Avoided transfer |
| Adjust | Route, peak, and buffer | Planning load | Peak-adjusted GB |
| Charge | Adjusted GB minus allowance | Billable model input | Chargeable transfer |
🧭Planning spec grid
💡Estimator tips
The old cloud trap is this: you build the app, you ship the code, and then you get the bill. While compute costs can be predictable, egress costs catch you off guard when they is hard to see, until they aren’t. Egress = unexpected surprises in the form of higher bills from cloud providers. But it’s more than bandwidth; it’s data gravity. Data likes where it lives. Moving it out into the world cost money. Know that dynamic makes a difference for media library and API response architecture.
Enter in your assumptions for traffic & rate and let the calculator above do the work. No need to guess at conversions and coefficients. It’s more important to understand what tools you have then the exact dollar amount. Bandwidth is a variable that most teams consider a fixed cost, when it isn’t. Through design choices, it is something you can impact. Using compression strategies and cache efficiency lead to a lower bill. You get to directly control these inputs.
How to Manage Your Cloud Costs
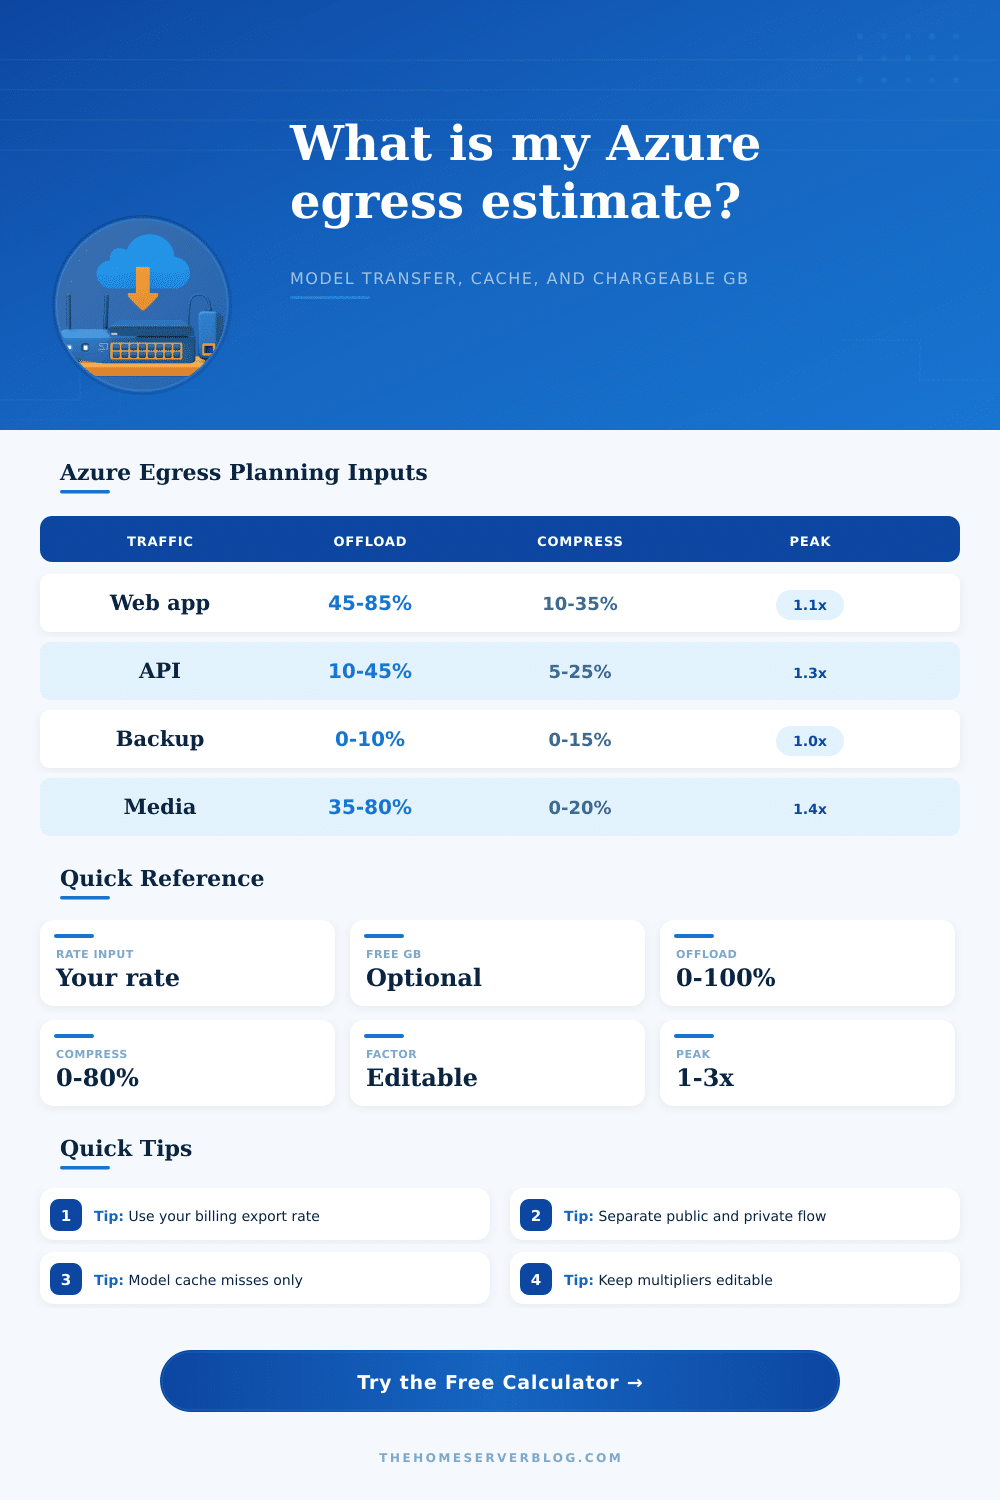
Let’s talk about the offload percentage for a second. That means how much traffic flows through your CDN (or your browser cache) instead of hitting your origin server. For a dynamic API, it’ll be lower (personalized, fresh data). For a static site, it’ll be higher (edge nodes doing the work). You can use the calculator to model those scenarios and understand what a cache miss does. I think people sometimes miss this: they look at total traffic and forget that most of it never actualy leaves their infrastructure if cached propery.
Costs are heavily influenced by compression, too. Brotli and other moddern protocols compress text-based payloads by 30 percent or more. A handful of kilobytes saved on every request isn’t something you’re likely to feel, but when that’s millions of API requests it adds up. By tweaking its reduction ratio, the tool let you understand how much paying for efficient payload handling is worth in terms of monthly credits. And it makes you consider if your servers pushes raw data around, or optimized streams.
Traffic offsets are important if you use a hybrid architecture (or have multiple regions) because there’s typically different pricing for traffic flowing inside the backbone network versus egress to the public internet. You need to subtract that internal traffic from your estimate so you don’t double count it; otherwise, you won’t see clearly what is truly exiting your cloud boundary. It removes noise from your forecast.
Peak factors are realistic because seasonal spikes, batch jobs, and campaigns results in bursts that get averaged out in normal metrics. A multiplier adds a safety buffer into those high-water marks so that the estimate doesn’t explode when load goes up and look deceptively low when it’s quiet. It’s building a plan for real usage, not some idealized version.
Finally, the reference tables allows for rapid benchmarking of typical workloads. For example, a media library is not the same as a web app, one is built for delivering large objects whereas the other is optimized for caching and compression. These presets allow you to sanity check your inputs ahead of time so that your budget isn’t something made up out of thin air. It ties abstract numbers to familiar architectural patterns.
Ultimately, egress management comes down to visibility. What you can’t measure, you can’t control. Tearing traffic apart into categories like private, compressible, and cacheable allows for actionable engineering decisions rather than vague concerns around getting a bill shock. You should of create efficient systems by design; not out of cost-cutting measures.
Next time you see that line item on the invoice, you’ll know what lever caused it to move. Did it move due to an honest growth? It was a compression failure? Was it a cache miss? That clarity will be worth more then any single month’s savings, and it will turn bandwidth into something you can manage; not a mystery.