GCP Egress Cost Calculator
Estimate outbound transfer using your own per-GB rate, destination class factor, inter-region factor, cache hit, compression, free allowance, and chargeable GB.
⚡GCP workload presets
📊Egress inputs
GCP egress estimate
🧮GCP traffic component grid
💻Editable egress factor reference
📘Workload preset table
| Preset | Typical GCP source | Optimization lever | What to verify |
|---|---|---|---|
| Static Web App | Cloud Storage, Load Balancer, Cloud Run | High cache hit and compression | Cache keys, TTLs, and asset versioning. |
| API Service | Cloud Run, GKE, Compute Engine | Response compression and selective cache | Private responses are not counted as cacheable. |
| Backup Export | Cloud Storage, Filestore, snapshots | Compression and destination factor | Which region and external path receives data. |
| Container Registry | Artifact Registry, GKE, CI runners | Layer cache and regional runners | Repeated pulls versus cache-warmed pulls. |
🌐Destination class table
| Destination class | Default factor | Use when | Modeling note |
|---|---|---|---|
| Internet users or external clients | 1.00x | Baseline public egress estimate | Enter the rate from your own pricing sheet or bill. |
| CDN-backed path or edge cache | 0.80x | Edge delivery changes the modeled path | Keep cache hit separate from destination factor. |
| Nearby region or continent | 0.85x | Regional weighting differs from baseline | Adjust the multiplier to match your scenario. |
| Inter-region transfer | 1.15x | Workloads move data between regions | Combine with the inter-region field for sensitivity. |
| Partner, VPN, or interconnect path | 0.70x | Private path has a negotiated or blended rate | Use a user-entered blended rate per GB. |
⚙Formula breakdown table
| Step | Formula | Input used | Result meaning |
|---|---|---|---|
| Compressed transfer | Outbound × (1 - compression) | Monthly outbound, compression percent | Payload after size reduction. |
| Cache miss egress | Compressed transfer × (1 - cache hit) | CDN/cache hit ratio | Traffic that still follows the charged path. |
| Weighted GB | Miss egress × destination × region × buffer | Class factor, inter-region factor, overhead | Equivalent GB before free allowance. |
| Estimated amount | Chargeable GB × your rate | Free allowance and rate per GB | Scenario total from your entered rate. |
📈Optimization planning table
| Lever | Best fit | Input to adjust | Watch-out |
|---|---|---|---|
| Cloud CDN or edge cache | Static files, images, public APIs | Cache hit ratio | Authenticated or rapidly changing content may miss. |
| Compression and object trimming | Text, JSON, HTML, logs, reports | Compression percent | Already-compressed video and archives may not shrink. |
| Regional placement | Multi-region apps and data pipelines | Inter-region multiplier | User location and data residency can constrain placement. |
| Billing export analysis | Any production workload | Rate per GB and free allowance | Blend only the SKUs that match this traffic path. |
When building an app on Google Cloud, you likely think about how much compute power or storage you’ll need. But what about the data going out? How much is that costing you? But what about the data going out? How much is that costing you?
That’s where egress comes in, and it’s a quiet tax collector. It doesn’t yell at you while you’re developing; instead, it whispers loudly when your users expands or when you begin copying data across regions for redundancy.
How to Control Your Google Cloud Data Costs
With some rough estimates, the calculator above will do the math for you so you don’t have to guess which coefficients realy apply to your configuration. Instead of taking generic average assumptions that almost never reflect reality, you provide your own rates, making abstract traffic patterns translate into concrete cost projections.
So here’s the first thing: Bytes aren’t equal in Google’s eyes, nor do they counts equally towards your bill. A byte of traffic going across a private interconnect or on the same continent as your server costs less then one heading to the open internet. But it also means that path selection affects economics, rather than just which class a destination falls into. (That’s shown in the reference table on the page).
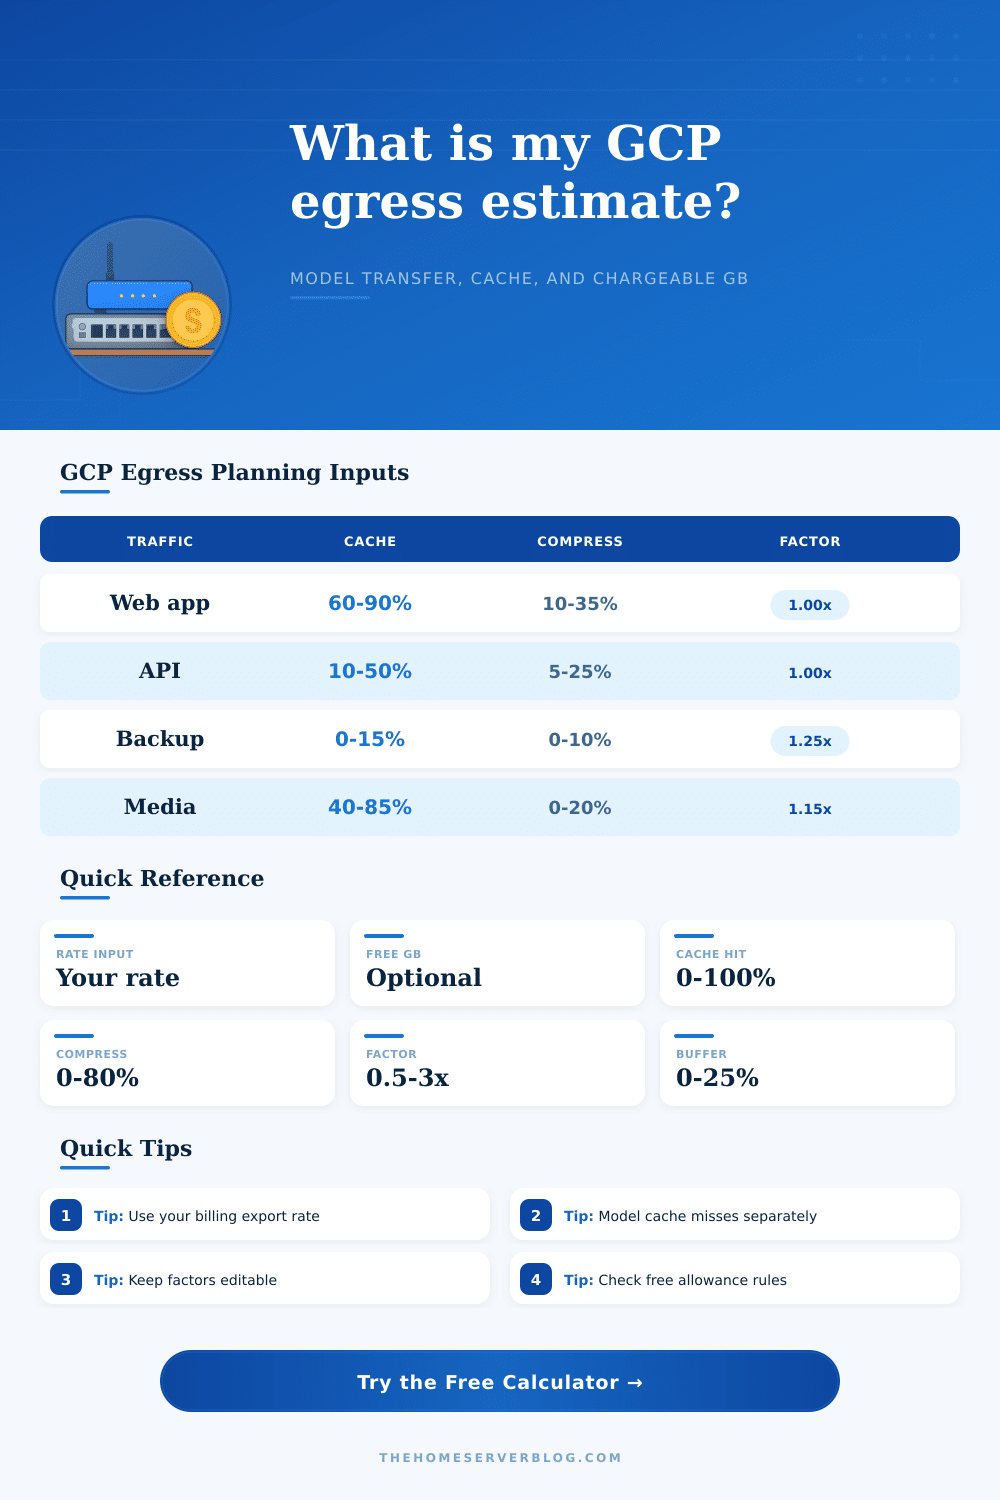
If your app pushes static content through a CDN, you move from paying full price for egress to only paying for missed cache hits. This means you pay for lower cost edge delivery and only for those bytes you had to pull from the origin because the cache wasn’t already holding them. This cache hit/miss difference is where most budgeting surprises lurk.
If you think you’re already squeezing every last byte out of those payloads, then yes: compression will also play a major role here. Even so, compressing text-based responses with gzip or brotli can save you significant amount of space. This reduces the data leaving your cloud environment. Remember, egress is volumetric. Every megabyte you shave off equals savings.
But you have to know how much to shave off. Many teams think their payload is already compressed, even when it isn’t. Because of this, they don’t include the extra size from retry headers and protocol headers that still add to your transfer amount. Having a safety buffer in your computation will help account for this hidden weight.
There’s also an additional level of confusion for new cloud customers: the concept of free allowances. For example, Google offers a certain number of free outbound transfers per month, but these get deducted upfront, before any other charges. That means if your optimised traffic just happens to be under the limit then you could end up paying zero. But if your traffic is ever even slightly over that mark, then everything past the limit will cost you at normal prices.
This is what the tool models; it’ll calculate your allowance against your overall weighted total and show you precisely how many bytes are now charged. This way, it challenges you to ask yourself: Is my current work on optimization keeping me in free territory, or am I pushing myself into an expensive area?
Beyond latency, your bottom line is affected by regional placement too. Multipliers apply not only to moving data within a region, but even more so when moving data between regions. These movements cross different network paths and may even span geographical borders. Data transfer charges will be incurred if your architecture has database replication from one continent to another for disaster recovery. This adds up over time, especially given how expensive cloud storage can be.
You can model this use case in the calculator by increasing the multiplier and setting the inter-region factor based off the geographic distance of your data transfers. This points out an overlooked tradeoff of high availability: it might come at the cost of hidden transfer costs.
With that you can work out the actual costs of your infrastructure so you have a better idea of what’s really driving your bills up. Are you rerouting traffic to less expensive paths? Are there caches being hit more often? You begin to see what changes your costs, and make better architecture choices instead of reacting to bill shock.
Knowing how much data leaves your network also makes it easier to negotiate for better commitments or know when to invest in self-paying optimization tools. Managing costs in the cloud isn’t voodoo discounting; it’s knowing the path your data takes. Knowing how much data is moving, how it gets there, and what it costs helps you predict your bill. This way, you won’t be scratching your head at the end of the month trying to figure out what happened.
It helps egress go from being a frighteningly unknown quantity to a line item on your balance sheet that you understand.