Kafka Partition Calculator
Estimate topic partitions, broker distribution, retained storage, segment count, and consumer parallelism from Kafka throughput assumptions.
Kafka capacity result
| Capacity item | Calculated value | Why it matters | Planning check |
|---|---|---|---|
| Partition plan | Run calculator | Sets consumer and leader spread | Keep balanced |
| Retention storage | Run calculator | Drives broker disk need | Include RF |
| Segment count | Run calculator | Affects file handles and recovery | Watch tiny files |
| Consumer ceiling | Run calculator | Limits one consumer group | Partitions cap it |
| Workload | Typical throughput | Partition target | Common retention |
|---|---|---|---|
| Home lab telemetry | 1 to 5 MB/s | 1 to 3 MB/s | 1 to 3 days |
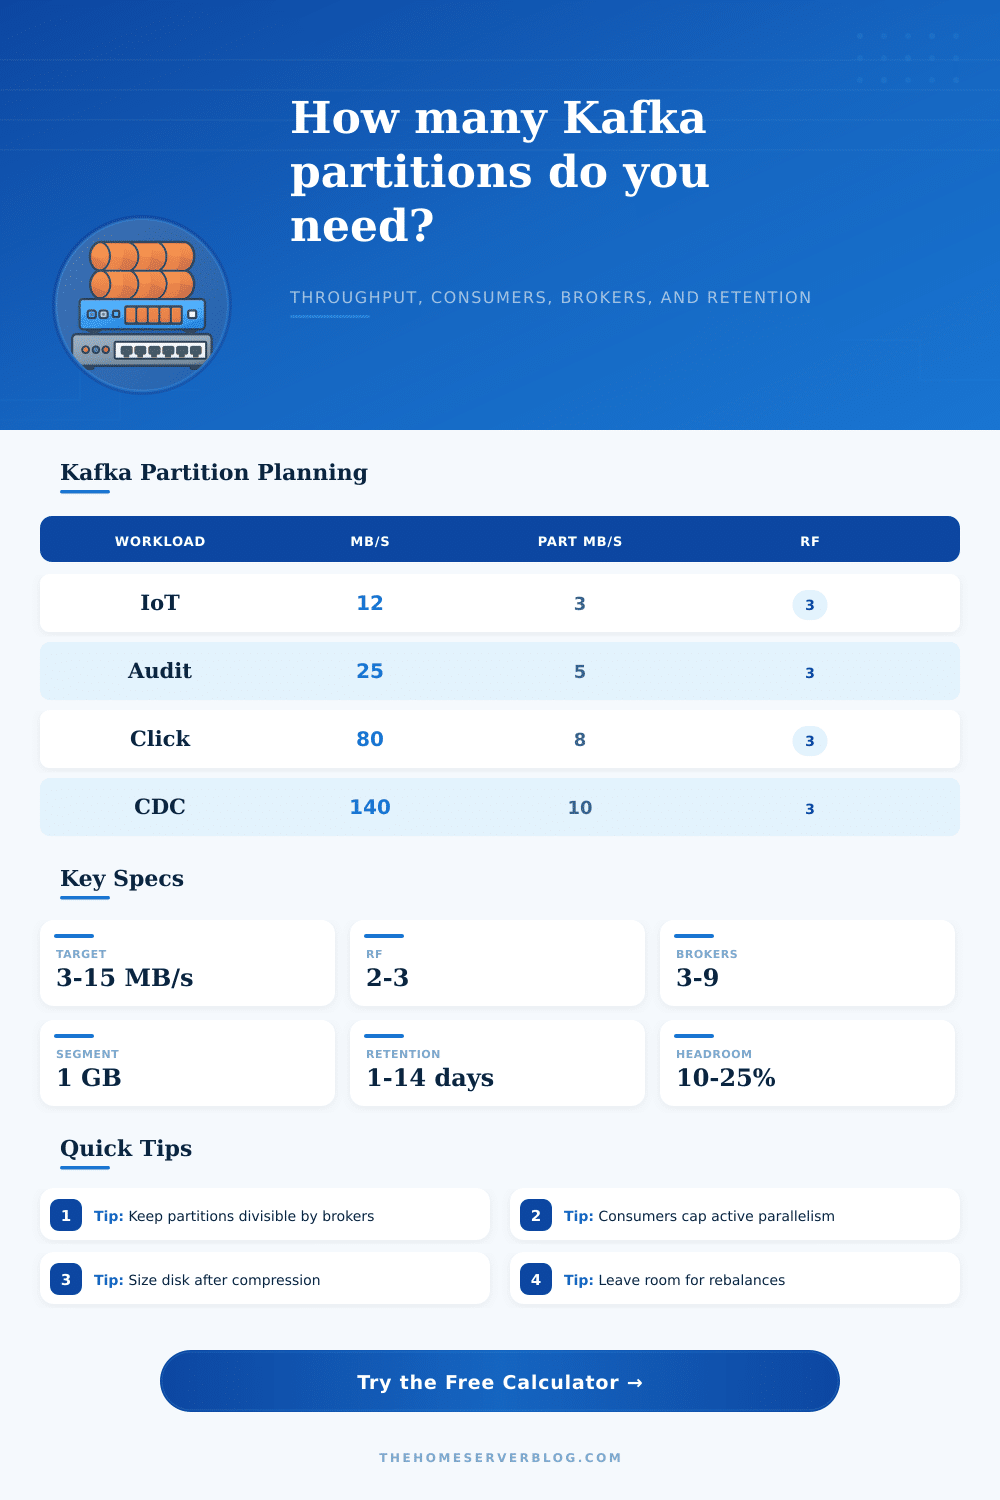
| Audit and security events | 10 to 40 MB/s | 3 to 6 MB/s | 7 to 30 days |
| Clickstream events | 40 to 150 MB/s | 6 to 12 MB/s | 3 to 14 days |
| CDC database stream | 50 to 250 MB/s | 8 to 15 MB/s | 1 to 7 days |
| Regional event bus | 200+ MB/s | 10 to 20 MB/s | 6 to 72 hours |
| Design factor | Low volume | Busy topic | High volume |
|---|---|---|---|
| Leader MB/s per partition | 1 to 3 | 4 to 10 | 10 to 20 |
| Consumer group parallelism | 2 to 6 | 8 to 32 | 32+ |
| Broker-friendly count | Multiple of brokers | Even leader spread | Check controller load |
| Rebalance headroom | 5% to 10% | 10% to 20% | 20% to 30% |
| Setting | Small cluster | Production start | Large topic |
|---|---|---|---|
| Replication factor | 2 | 3 | 3 or 4 |
| Segment size | 256 to 512 MB | 1024 MB | 1024 to 2048 MB |
| Retention window | 24 to 72 hours | 7 days | Policy driven |
| Disk reserve | 20% | 30% | 35%+ |
For clickstream data, you pick a topic and say, “let’s partition by ten.” Ten seems like a good number. Everything goes well until Black Friday hits and your consumers crash into a hard ceiling when traffic spikes. If you need to increase capacity, you cannot move that ceiling without a painful rebalance.
Partitions is the hardest architectural decision you’ll ever make in a Kafka cluster. They’re the one thing that you can’t change afterwards without rewriting every single key in the topic. It will mess up consumer offsets and make you cry for days. The calculator spits out the numbers for you; but knowing how they impact production prevents fires.
Why Choosing Partitions is Important
And there’s the main point: the tension between parallelism limits and throughput needs. To take your incoming write rate, you require a sufficient number of partition so as not to overload any single leader with writes. And to accommodate all your consumer instances working at once, you require a sufficient number of partitions as well. What happens when you can’t give every consumer instance its own partition? Twenty consumers? Ten partitions? Half your fleet just idles. The rest burns through CPU cycles.
The hard-and-fast Kafka rule here is that each consumer instance in a group is assigned at most one partition. That’s an absolute constraint. Before deploying, ensure that the number of partitions is equal to or greater than what you think you will need for maximum parallelism. Estimating instead of guessing how much you want to get through is important (and difficult).
While most SSDs today aren’t great at handling random writes, they are even worse if the write is very small. It is fragmented across many files. You should set your target as megabytes/second/per partition so that each leader gets enough work to be efficient but not too much. Because our tool takes your total expected amount of work divided by a conservative per-partition number, it finds an appropriate balance for you. Then, it makes sure you have enough partitions to deal with your consumer count. This gives you a double check to make sure you don’t under-provision on either dimension.
Another area where I see new architects trip up is in their planning for storage. Often they compute their disk requirements as simply the number of messages they need to store. They don’t take into account any compression ratios, or even replication factors. For example, if they’re storing 50 megabytes per second of audit logs for seven days with a replication factor of three, then things get multiplied out fast. The calculator takes all of those factors into account, including replication factor, retention window, and compression ratio, to show you the true disk footprint of your cluster. It will also estimate the number of segment files, since too many little segments can realy slow down bootstrap times when brokers restart. We’ll get to more details on the storage calculator later.
The last part of the puzzle is how brokers get distributed. To balance out disk usage and network I/O, Kafka works best if its leader partitions are evenly spread across all of its brokers. Whenever possible, round your number of partitions to a multiple of the number of brokers. That’s a little math trick that simplifies manual rebalancing. While Kafka is doing its thing normally, it also distributes leaders more evenly using the internal metadata controller. A small detail, but it just removes one source of friction for when you want to take nodes in and out of the cluster down the road.
In the real world, things don’t stand still: Your three-broker system could turn into a nine-broker system after one year. In this case, having only three partitions at first will force you to add new ones later, resulting in all those costly key reassignments. Too many partition create administrative work when it comes to managing their metadata in ZooKeeper. And because each partition means more thread contexts and more open file descriptors, there is significant GC pressure on the broker JVMs. The sweet spot tends to be in the middle. That gives you headroom for growth, but doesn’t drown your brokers under an avalanche of administration.
To help with this, they’ve put together a few benchmark numbers on their page that give you an idea of what kind of throughput you can expect based off common kinds of workloads (CDC stream, IoT telemetry, etc.). For example, if you want to handle something like compliance logs where durability is most important and lower latency isn’t as critical, you’ll see a much different throughput. This compares to something like financial transaction handling which needs very low latency. Take those numbers as a baseline, run it through the final calculation and see what results come out. Over-estimating by a bit is preferable to having to restructure your topics post-launch.
The key here is not meeting today’s metrics but anticipating tomorrow’s pain points. You are creating infrastructure that must handle scale events, roll out new features, and weather unexpected traffic spikes. If you size a cluster correctly it won’t fight back; it’ll grow along with your app. Get the partition number correct at the beginning and you don’t end up suffering through a dreaded rebalance storm down the road. Your system can quietly be handling whatever comes its way without skipping a beat. And the effort you put into the planning upfront pays off in stability long after the code is live.