SLO Burn Rate Calculator
Calculate error budget burn rate, consumed budget, time to exhaust, and multi-window alert severity from your SLO target, observed error rate, request volume, alert windows, and remaining budget.
Availability or success target. Error budget is 100% minus this target.
Common SLO periods are 7, 28, 30, or 90 days.
Used to estimate period-to-date budget consumption.
Enter the current remaining error budget from your SLO dashboard.
Use failed requests, bad minutes, or another user-visible SLI numerator.
The calculator scales error counts by your short and long alert windows.
Fast window used to reduce paging delay.
Slow window used to filter brief spikes.
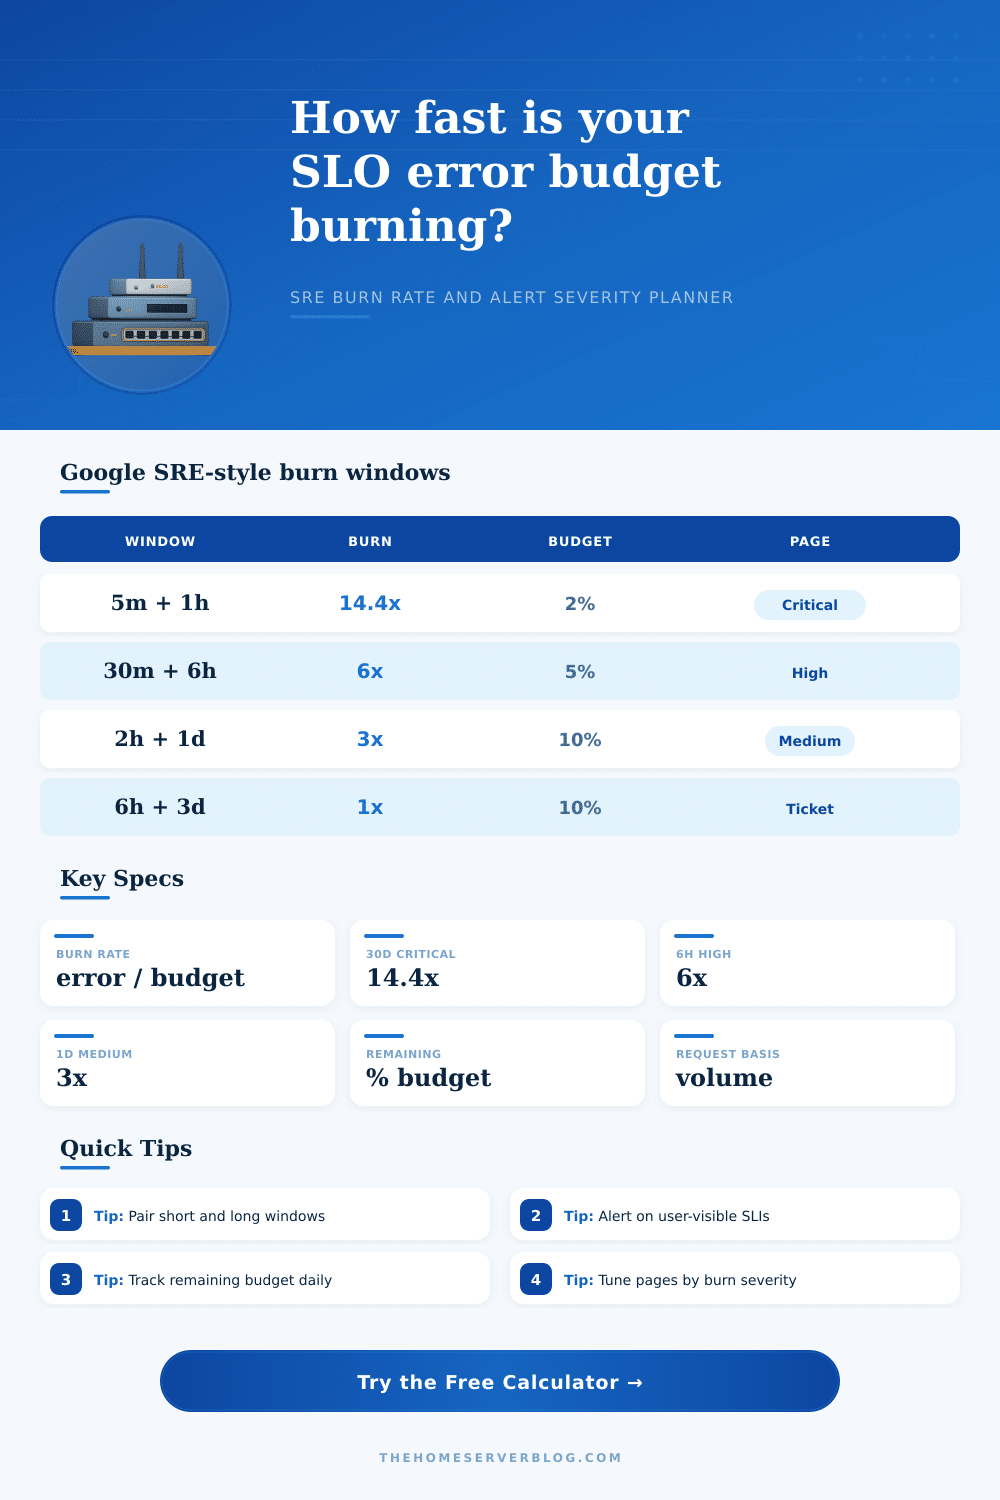
Google SRE-style critical page commonly uses 14.4x for 5m and 1h windows.
Use this to compare a second multi-window policy such as 30m and 6h at 6x.
Formula: burn rate = observed error rate / error budget rate. A 99.9% SLO has a 0.1% error budget, so a 0.2% observed error rate is burning at 2x.
Burn Breakdown
How much of the full-period error budget is being spent each day.
Allowed bad requests for the whole SLO period at current traffic.
Estimated bad requests so far, using elapsed days and current error rate.
The maximum average error rate that would burn exactly 1x.
| Alert Policy | Short + Long Window | Burn Threshold | Budget Consumed | Action |
|---|---|---|---|---|
| Critical page | 5m + 1h | 14.4x | About 2% in 1 hour | Page now; user impact is fast and budget-heavy. |
| High page | 30m + 6h | 6x | About 5% in 6 hours | Page or incident channel depending on service criticality. |
| Medium ticket | 2h + 1d | 3x | About 10% in 1 day | Investigate during the current shift. |
| Slow burn ticket | 6h + 3d | 1x | About 10% in 3 days | File work, tune capacity, or review noisy releases. |
| Window Pair | Calculated Burn | Threshold | Status | Estimated Errors |
|---|---|---|---|---|
| 5m + 1h | 1.80x | 14.4x | OK | 180 / 2,160 |
| SLO Target | Error Budget | Budget Errors At This Volume | Current Burn Rate | Interpretation |
|---|---|---|---|---|
| 99.9% | 0.1% | 72,000 | 1.8x | Above steady-state budget. |
Late at night, with traditional alerts falling silent: An SLO burn rate calculator will help cut through the noise and distinguish signal from crisis.
Availability looks green, but users is complaining of latency at 3 AM. That’s where Site Reliability Engineering excels. The tool expresses raw percentages as velocity. “how fast?”) to tell you whether to page the team, or just sleep on it. No need for mental arithmetic amidst a crisis; the tool do all that math for you.
Why Use an SLO Burn Rate Calculator
To me the concept of error budget is about two things: (1) Perfection costs; and (2) The 99.9% of time you’re fine, you’ve already said you’ll be wrong 0.1% of the time. So that’s your budget. When the cloud gets wonky, or you want to ship some risky feature, you spend from that sliver. And here’s the thing, it isn’t so much that you don’t have any left. It’s that you used up all of yours way too quickley, with nobody noticing. A slow leak drains a tire just as well as a hole does, though it doesn’t usually cause an emergency response until it’s to late.
But what about your burn rate? How fast are you burning through your reliability? The definition of burn rate here is your observed error rate / your allocated error budget. For example, if you have a 0.1% error budget but so far this month you’re seeing 0.2%, then you’re burning at 2x. You’re spending twice as quick than you budgeted for. Once you enter your current error volume, period length, and target into the calculator, it’ll do the math for you.
When most teams view alerts, they look at one point in time. It could be a 5 minute spike, maybe just a glitch? Or it’s a 6 hour sustained increase, a problem we should of fix! The Google SRE model addresses this through short/long alert windows. The fast window catches sharp outages before they widen. Slow window (confirm it’s sustained enough to burn real budget). The key is dual-windows so you don’t page on every little hiccup, but also catch the fires that matter.
The burn rate shows how aggressive it is. How severe is the alert? The burn rate typically triggers a critical alert when you spend 14.4 times your usual amount in a short time. In other words, you are spending ~2% of your monthly budget in an hour. If this continues, then you’ll exhaust your allowance in days rather than weeks. Medium- and high-priority alerts might trigger for lower burn rates. It’s enough time to allow the team to investigate but not wake everyone up at dawn. The page contains a reference table mapping burn multiples to corresponding actions so you don’t need to guess what to escalate.
The other tricky input is how many requests are we talking about? The burn rates are shown as unitless ratios, but they matter only at scale. If you have a home lab project and your error rate is 1%, that’s no big deal. On a global checkout flow, a 1% error rate translates into millions of frustrated users. To determine whether the absolute number of bad requests reaching your system is negligible, you’ll want to consider your true traffic levels. That will help you assess whether the amount of budget left over is truly safe, or just a mirage created during low-traffic periods.
Secondly, you need to honestely measure things. Blindness to half the pain is blindness if your SLI measures nothing but the status code on the server and fails to account for slow response time that times out in the client. User experience is what matters for error budgets, not infrastructure health. Aligning your measurements with impact in the real world makes the burn rate a genuine leading indicator of trouble.
Why? This causes you to view reliability as a consumable resource instead of an abstract goal. Pace yourself, because that’s what it really comes down to with SLO management. Don’t go wild with your spend in the early days, then complain of everything breaking later on. As you track your burn rate, you’ll be able to control the pace of your releases: high burn? Pause and fix. Low burn? Green light, let’s get innovative! It turns reliability into a manageable ledger. Not no errors. Just know exactly when to pull back before the bill comes due.