Ethernet Overhead Calculator
Model layer-2 Ethernet wire usage from payload size, MAC framing, FCS, VLAN or QinQ tags, jumbo MTU, preamble, inter-frame gap, and traffic volume.
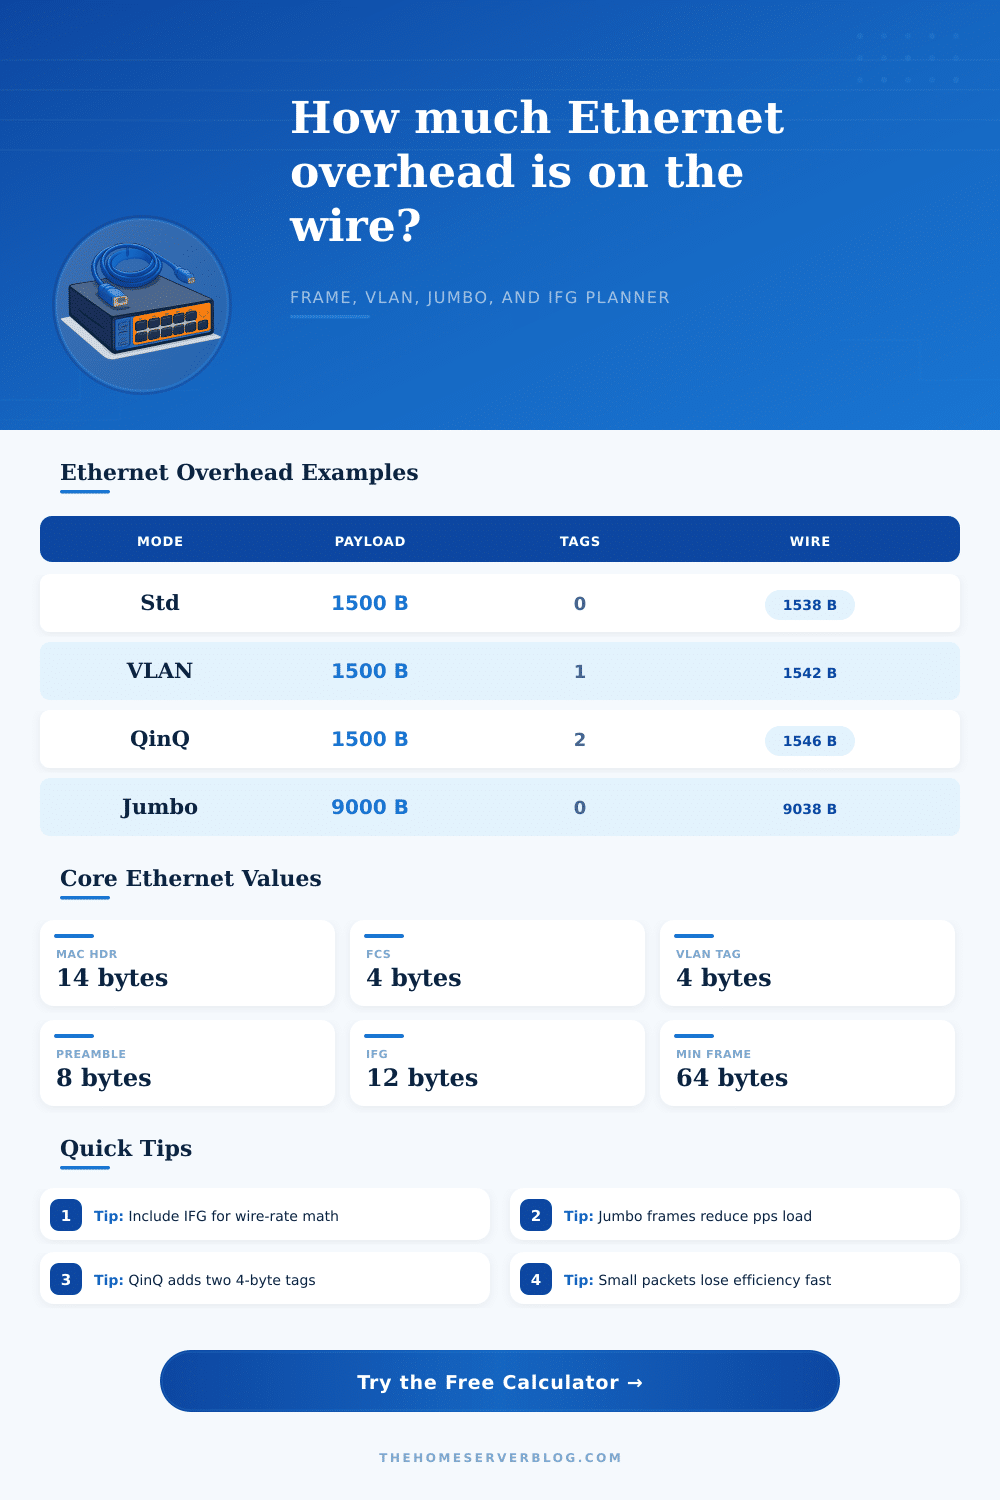
| Frame type | Payload | Tags | Frame bytes before preamble/IFG |
|---|---|---|---|
| Minimum Ethernet | 46 bytes or less | 0 | 64 bytes after padding and FCS |
| Standard untagged | 1500 bytes | 0 | 1518 bytes |
| 802.1Q VLAN | 1500 bytes | 1 | 1522 bytes |
| QinQ stacked VLAN | 1500 bytes | 2 | 1526 bytes |
| Jumbo storage | 9000 bytes | 0 | 9018 bytes |
| Link | Bit rate | 1500B max pps | 9000B max pps |
|---|---|---|---|
| 1 GbE | 1,000 Mb/s | about 81k pps | about 13.8k pps |
| 2.5 GbE | 2,500 Mb/s | about 203k pps | about 34.6k pps |
| 10 GbE | 10,000 Mb/s | about 813k pps | about 138k pps |
| 25 GbE | 25,000 Mb/s | about 2.03M pps | about 346k pps |
| Option | Bytes | Where it applies | Planning note |
|---|---|---|---|
| MAC header | 14 | Every Ethernet frame | Destination, source, EtherType |
| FCS | 4 | Every normal frame | Usually hidden by NICs |
| VLAN | 4 each | Trunks and tagged access | QinQ means two tags |
| Preamble/SFD | 8 | Physical wire timing | Needed for line-rate pps |
| IFG | 12 | Idle slot after frame | Include for wire efficiency |
| Home lab use | Typical MTU | VLAN style | What to watch |
|---|---|---|---|
| NAS file copy | 1500 or 9000 | Untagged or 1 tag | End-to-end jumbo support |
| Virtualization host | 1500 to 9000 | Many tagged networks | vSwitch and NIC offloads |
| ISP handoff | 1500 | VLAN or QinQ | Provider MTU allowance |
| VoIP or telemetry | 60 to 300 | Often tagged | Small frames raise pps load |
Overhead. Overhead consumes valuable bandwidth in an Ethernet frame. Headers, footers and things not visible to humans (like the preamble) consume overhead. Before your data gets to your application or even your disk, you lose a little bit of speed.
Knowing about it allows you to debug jittery voice traffic. It also lets you plan out how high throughput storage needs to be. Use the calculator on this page to see how much framing vs See how much payload your wire has.
Understanding Ethernet Overhead
A footer and header are required to be added to every Ethernet frame. The footer’s used for error checking; the header has the source and destination address. Fixed costs that aren’t visible include the preamble and the time required to go idle between frames.
When you’re sending tiny packets, more space is consumed by these fixed costs. You may be sending small chunks of VoIP audio or tiny telemetry updates. When this happens, the framing overhead approach almost half of the bits going over the wire. That inefficiency increases the number of packets per second flowing through your switches. If they can’t handle the packet rate, the link saturates. It might sound like your bandwidth usage isn’t very high yet it’s still a full connection.
Now consider that we’re sending a bigger packet. With a jumbo frame, our max transmission unit increases from 1,500 bytes to 9,000. That reduces the overhead cost per byte for the fixed header. Because we’re sending so much useful data, the ratio of overhead to payload decrease.
That doesn’t mean every place gets jumbo frames. Any device along the way needs to be able to handle the increased size. Virtual switches. Routers. Everything. If even a single hop drops the jumbo frame then the connection will fail or fragment.
The tool allows you to visually compare those two options side-by-side. You can compare the potential gain different than the operational risk.
What most people don’t think about is VLAN tagging. Four bytes are added to each frame by each tag. At first glance it’s not much, but then consider when providers use QinQ and stack VLAN tags through their networks. Then that doubles the cost. Under heavy load, those additional bytes really start to add up. Thousands of frames per second from an application can consume large amounts of processing and bandwidth with those bytes. Consider whether segmenting is worth the cost in the wires. The calculator automatically includes these tags. They show how much these tags impact the resulting goodput calculation.
Without context, raw numbers are deceiving. It could appear that a high rate of packets is good; however, that will swamp switches with budget ASICS. Such switches has small buffers. On the other hand, larger frame sizes at a low packet rate reduce CPU load on servers. Fewer interrupts means less work for each megabyte of data. This is the heart of robust network design. You’re looking to get efficient while not pushing limits of devices. Small packets stress the controller; large packets stress the buffer. Device capability plus traffic profile decides this sweet spot.
Look carefully at the breakdown and look at the wire efficiency line. That’s a measure of data vs protocol overhead. Are you getting your money’s worth when it comes to transmission time? Low number on this one means you’re paying for nothing but time. A way to increase this is by increasing payload or decreasing tagging.
Speed isn’t the only factor in network design. The other factors are predictability and consistency. Overhead calculation builds into predictability. It takes the guess out of capacity planning. Before you plug in the cables you’ll know whether they’ll hold up under load. This lets you see the unseen cost, which makes abstractions real. You go from fretting over hypothetical maxes to optimizing for what actualy works in the wild.
The speed of your frames is bound by whatever holds them back and by its slowest part. Knowing this allows you to construct lean networks that transport data efficienty and with minimal unexpected bottlenecks. Taking the time to understand this before launch would of been a good investment.